Copyright
©2007 Baishideng Publishing Group Inc.
World J Gastroenterol. Jul 7, 2007; 13(25): 3493-3499
Published online Jul 7, 2007. doi: 10.3748/wjg.v13.i25.3493
Published online Jul 7, 2007. doi: 10.3748/wjg.v13.i25.3493
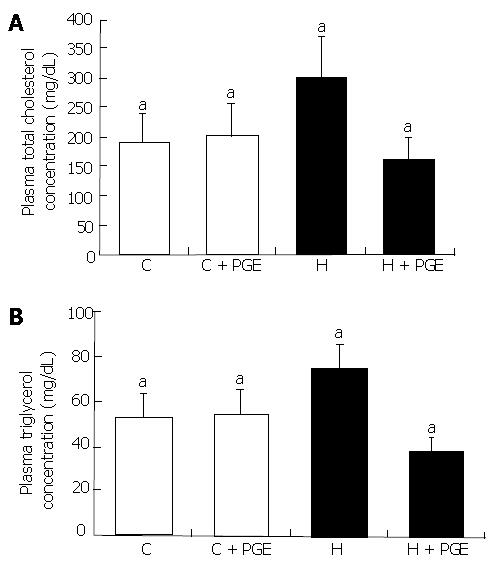
Figure 4 Effects of PGE on the plasma TC and TG concentrations of obese rats.
C: Control normal fat diet group (n = 10); H: 30% lard containing high fat diet group (n = 10); C + PGE: Control rats orally administered 150 mg/100 g body weight of PGE group (n = 10); H + PGE: High fat feeding with administered PGE orally at the concentration of 150 mg/100 g body weight group (n = 10). Values are mean ± SE. They were compared using the ANOVA and post Tukey test. P < 0.05 was considered statistically significant.
-
Citation: Park YS, Yoon Y, Ahn HS.
Platycodon grandiflorum extract represses up-regulated adipocyte fatty acid binding protein triggered by a high fat feeding in obese rats. World J Gastroenterol 2007; 13(25): 3493-3499 - URL: https://www.wjgnet.com/1007-9327/full/v13/i25/3493.htm
- DOI: https://dx.doi.org/10.3748/wjg.v13.i25.3493


