Copyright
©2007 Baishideng Publishing Group Inc.
World J Gastroenterol. Jul 7, 2007; 13(25): 3478-3486
Published online Jul 7, 2007. doi: 10.3748/wjg.v13.i25.3478
Published online Jul 7, 2007. doi: 10.3748/wjg.v13.i25.3478
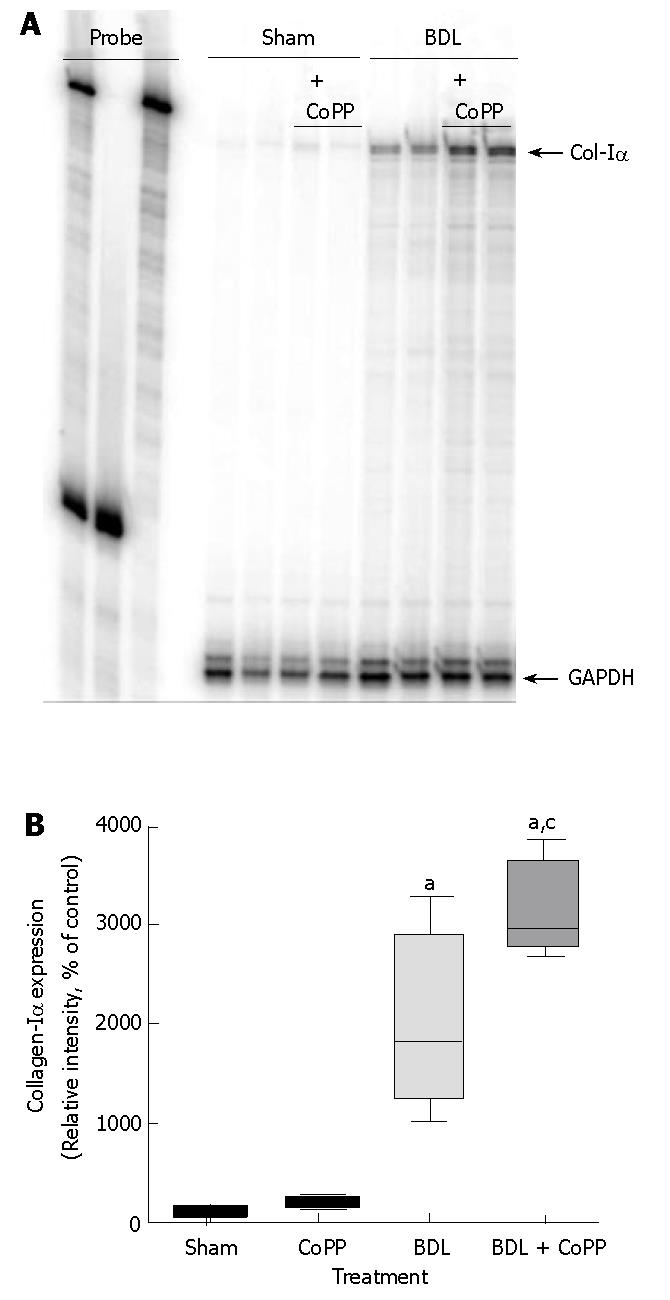
Figure 7 Effects of cholestasis and HO-1 overexpression on collagen-Iα mRNA expression.
Livers were harvested 3 wk after BDL, perfused with normal saline, and frozen in liquid nitrogen. RNase protection assays were performed using an individual probe. Values are means ± SD (n = 4 in each group). Specific bands were quantitated by scanning densitometry and normalized to the signal of GAPDH. A: representative autoradiogram of collagen-Iα mRNA expression; B: densitometric analysis of collagen-Iα mRNA expression. aP < 0.05 vs sham-operated groups, CP < 0.05 vs bile duct-ligated group receiving saline.
- Citation: Froh M, Conzelmann L, Walbrun P, Netter S, Wiest R, Wheeler MD, Lehnert M, Uesugi T, Scholmerich J, Thurman RG. Heme oxygenase-1 overexpression increases liver injury after bile duct ligation in rats. World J Gastroenterol 2007; 13(25): 3478-3486
- URL: https://www.wjgnet.com/1007-9327/full/v13/i25/3478.htm
- DOI: https://dx.doi.org/10.3748/wjg.v13.i25.3478


