Copyright
©2007 Baishideng Publishing Group Co.
World J Gastroenterol. Jun 7, 2007; 13(21): 2939-2944
Published online Jun 7, 2007. doi: 10.3748/wjg.v13.i21.2939
Published online Jun 7, 2007. doi: 10.3748/wjg.v13.i21.2939
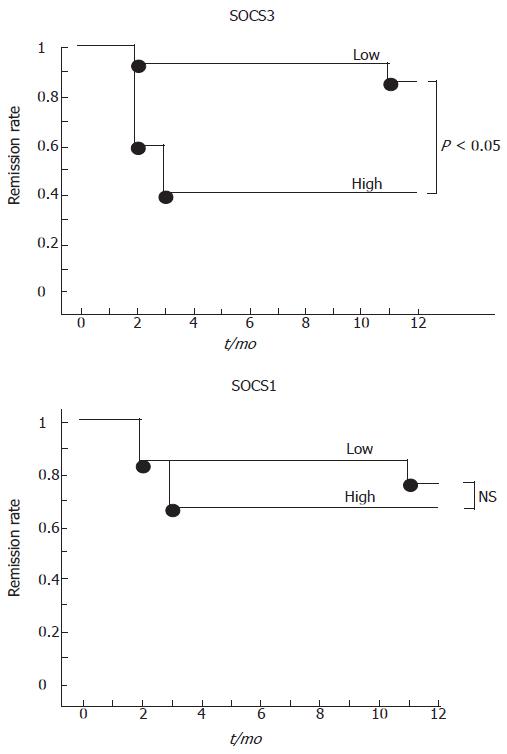
Figure 7 Kaplan-Meier time to relapse curves for patients with UC in relation to the expression of SOCS mRNAs.
There is a significant difference (P < 0.05, log rank) in the proportion of patients who relapsed over a 12-mo period with respect to the levels of mucosal SOCS3 (> or < 0.3) at time of inclusion in the study. There was no correlation between SOCS1 and remission rate. NS: not significant.
- Citation: Miyanaka Y, Ueno Y, Tanaka S, Yoshioka K, Hatakeyama T, Shimamoto M, Sumii M, Chayama K. Clinical significance of mucosal suppressors of cytokine signaling 3 expression in ulcerative colitis. World J Gastroenterol 2007; 13(21): 2939-2944
- URL: https://www.wjgnet.com/1007-9327/full/v13/i21/2939.htm
- DOI: https://dx.doi.org/10.3748/wjg.v13.i21.2939


