Copyright
©2007 Baishideng Publishing Group Co.
World J Gastroenterol. Jun 7, 2007; 13(21): 2939-2944
Published online Jun 7, 2007. doi: 10.3748/wjg.v13.i21.2939
Published online Jun 7, 2007. doi: 10.3748/wjg.v13.i21.2939
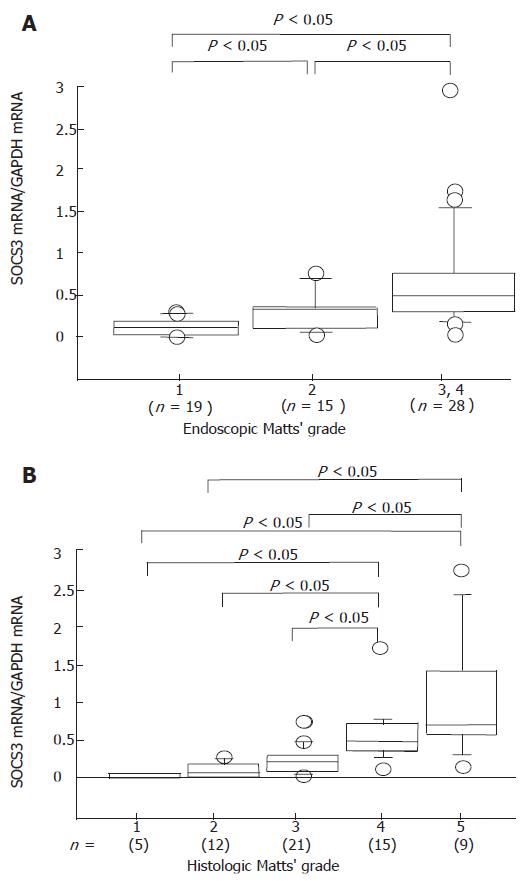
Figure 2 Relation between the degree of endoscopic (A) and histologic (B) inflammation and levels of SOCS3.
The levels of SOCS3 mRNA were determined by quantitative RT-PCR. Box graphic top, bottom, and middle correspond to 75th, 25th, and 50th percentiles (median), respectively. Bar shows 5th and 95th percentiles. The mean + SD of endoscopic Matts’ grade was 0.116 + 0.094 for Matts'1, 0.280 + 0.219 for Matts'2, and 0.673 + 0.599 for Matts'3 and 4. The mean + SD of histologic Matts’ grade was 0.038 + 0.048 for Matts’1, 0.124 + 0.102 for Matts'2, 0.250 + 0.174 for Matts'3, 0.597 + 0.371 for Matts'4, and 1.039 + 0.821 for Matts'5. There was a significant correlation between SOCS3 expression in the colonic mucosa and Matts’ grade.
- Citation: Miyanaka Y, Ueno Y, Tanaka S, Yoshioka K, Hatakeyama T, Shimamoto M, Sumii M, Chayama K. Clinical significance of mucosal suppressors of cytokine signaling 3 expression in ulcerative colitis. World J Gastroenterol 2007; 13(21): 2939-2944
- URL: https://www.wjgnet.com/1007-9327/full/v13/i21/2939.htm
- DOI: https://dx.doi.org/10.3748/wjg.v13.i21.2939


