Copyright
©2007 Baishideng Publishing Group Co.
World J Gastroenterol. May 28, 2007; 13(20): 2826-2832
Published online May 28, 2007. doi: 10.3748/wjg.v13.i20.2826
Published online May 28, 2007. doi: 10.3748/wjg.v13.i20.2826
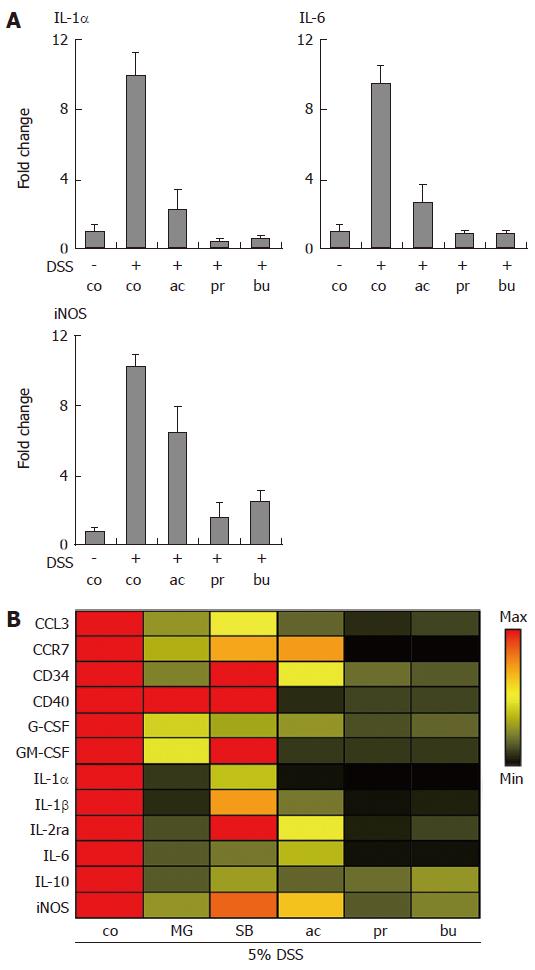
Figure 4 Transcriptional profiling of gene expression in Short-Chain Fatty Acid-treated organ cultures.
Dextran sulphate sodium (DSS) was used to induce colonic inflammation. (A) Organ cultures were incubated with acetate, propionate or butyrate (all 30 mmol/L) for 24 h followed by analysis of IL-1α, IL-6 and iNOS mRNA levels. Data was normalized to GAPDH mRNA levels and presented as fold change relative to control levels. Mean ± SEM (n = 4). (B) Heat map representation of gene expression changes induced by MG-132, SB203580 (both 10 μmol/L); acetate, propionate and butyrate (all 30 mmol/L). Data was normalized to GAPDH and expressed as the ratio between treatment and control. control (co), acetate (ac), propionate (pr), butyrate (bu), MG-132 (MG), SB203580 (SB).
- Citation: Tedelind S, Westberg F, Kjerrulf M, Vidal A. Anti-inflammatory properties of the short-chain fatty acids acetate and propionate: A study with relevance to inflammatory bowel disease. World J Gastroenterol 2007; 13(20): 2826-2832
- URL: https://www.wjgnet.com/1007-9327/full/v13/i20/2826.htm
- DOI: https://dx.doi.org/10.3748/wjg.v13.i20.2826


