Copyright
©2007 Baishideng Publishing Group Co.
World J Gastroenterol. Jan 14, 2007; 13(2): 250-256
Published online Jan 14, 2007. doi: 10.3748/wjg.v13.i2.250
Published online Jan 14, 2007. doi: 10.3748/wjg.v13.i2.250
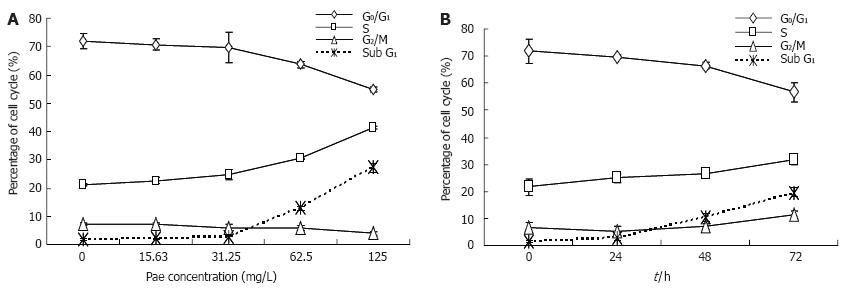
Figure 4 Effect of Pae on cell cycle in HepG2 cells.
The distribution of cells in the sub-G1, G0/G1, S, and G2/M phases of the cell cycle were calculated and plotted. (A): Dose-dependent curve of cell cycle distribution induced by Pae. (B): Time-dependent curve of cell cycle distribution induced by Pae 31.25 mg/L. Each point represents triplicate experiments. Bars ± SE.
- Citation: Xu SP, Sun GP, Shen YX, Wei W, Peng WR, Wang H. Antiproliferation and apoptosis induction of paeonol in HepG2 cells. World J Gastroenterol 2007; 13(2): 250-256
- URL: https://www.wjgnet.com/1007-9327/full/v13/i2/250.htm
- DOI: https://dx.doi.org/10.3748/wjg.v13.i2.250


