Copyright
©2007 Baishideng Publishing Group Co.
World J Gastroenterol. Jan 14, 2007; 13(2): 236-243
Published online Jan 14, 2007. doi: 10.3748/wjg.v13.i2.236
Published online Jan 14, 2007. doi: 10.3748/wjg.v13.i2.236
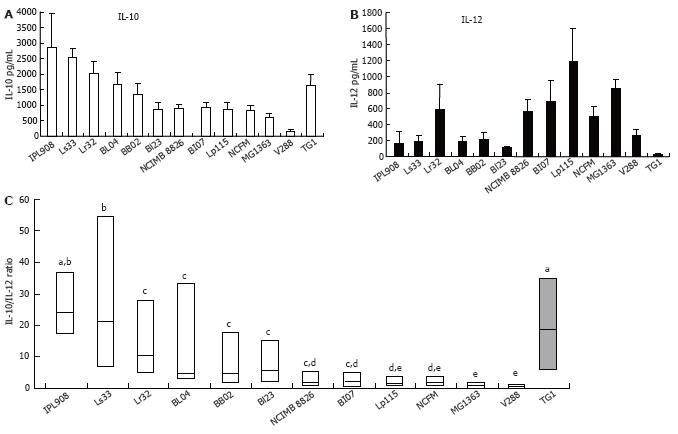
Figure 1 Strain-specific patterns of IL-10 (A) and IL-12p70 (B) release for various bacterial strains and IL-10/IL-12 ratios (C) for 6 to 12 independent healthy donors.
Bars represent the mean ± SE values in pg/mL for 6 to 12 independent healthy donors. Ranked box and whisker plots show the median values and first to third quartiles in boxes. Different letters indicate significant differences according to Mann-Whitney U test (P < 0.05).
-
Citation: Foligne B, Nutten S, Grangette C, Dennin V, Goudercourt D, Poiret S, Dewulf J, Brassart D, Mercenier A, Pot B. Correlation between
in vitro andin vivo immunomodulatory properties of lactic acid bacteria. World J Gastroenterol 2007; 13(2): 236-243 - URL: https://www.wjgnet.com/1007-9327/full/v13/i2/236.htm
- DOI: https://dx.doi.org/10.3748/wjg.v13.i2.236


