Copyright
©2007 Baishideng Publishing Group Co.
World J Gastroenterol. Jan 14, 2007; 13(2): 192-218
Published online Jan 14, 2007. doi: 10.3748/wjg.v13.i2.192
Published online Jan 14, 2007. doi: 10.3748/wjg.v13.i2.192
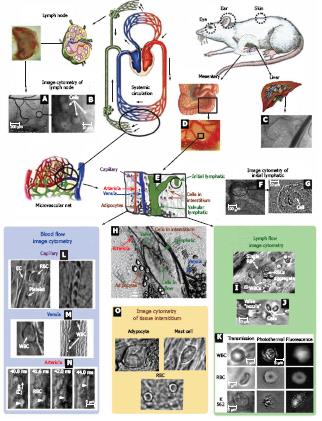
Figure 3 In vivo monitoring of microcirculation using rat mesentery.
A, B: Sections of a single lymph node at different magnifications (4 × and 100 ×, respectively); C: liver section (10 ×); D: section of intestine with mesentery; E: schematic of typical tissue microvascular unit; F, G: initial lymphatic (4 × and 100 ×); H: section of mesenteric tissue with valvular lymph vessel and surrounding blood vessels (10 ×); I: high-resolution imaging of single WBCs and RBCs, as well as their aggregates in lymph flow (100 ×); J: valve tip with fast-flowing cells (100 ×); K: transmission, photothermal, and fluorescence images of individual WBC, RBC, and K562 leukemic cell in lymph flow; L: capillary at different magnifications, (left) high-resolution images of RBCs, platelets, and endothelial cells (EC) in capillary wall (100 ×) and (right) parachute-like RBCs at low magnification (10 ×); M: rolling WBC in venula (100 ×, 10 ×); N: four sequential high-resolution images of RBC shapes in fast arteriolar flow (velocity of 5 mm/s; 40 ×); O: high-resolution images of adipocyte, mast cell, and RBCs in the interstitial space (100 ×).
-
Citation: Galanzha EI, Tuchin VV, Zharov VP. Advances in small animal mesentery models for
in vivo flow cytometry, dynamic microscopy, and drug screening. World J Gastroenterol 2007; 13(2): 192-218 - URL: https://www.wjgnet.com/1007-9327/full/v13/i2/192.htm
- DOI: https://dx.doi.org/10.3748/wjg.v13.i2.192


