Copyright
©2007 Baishideng Publishing Group Co.
World J Gastroenterol. Jan 14, 2007; 13(2): 175-191
Published online Jan 14, 2007. doi: 10.3748/wjg.v13.i2.175
Published online Jan 14, 2007. doi: 10.3748/wjg.v13.i2.175
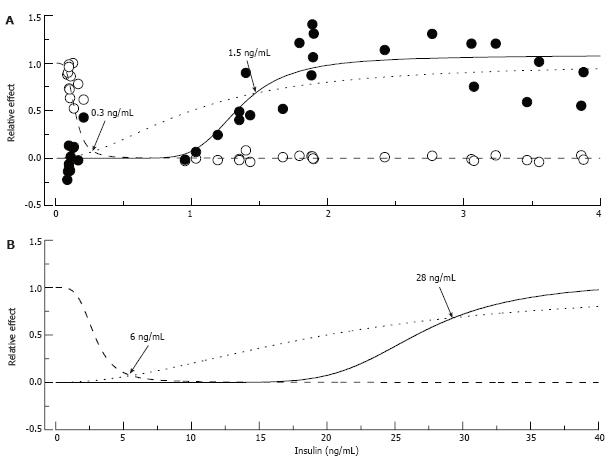
Figure 10 Putative “insulin-glucose metabolism” and “insulin-nerve function” relationships in normal and insulin-resistant rats.
In A: Normal rats: Empty circles represent fasting glucose and filled circles pain pressure thresholds measured in control, STZ-NG and STZ-HG rats, pooled together and normalized to show relative changes of these parameter between control and diabetic animals. The data were fitted by Hill curves calculated based on the assumption that insulin binds to the receptor with an affinity of 1 ng/mL (dotted curve) and 10% and 65% occupancy of these receptors is required for maximum metabolic (intersection with dashed curve) and nerve (intersection with solid curve) effect of the hormone, respectively. In B: Insulin-Resistant Rats: Insulin resistant state was simulated by increasing K0.5 of insulin binding to the receptor to 20 ng/mL. Points of intersections of the dotted curve with the dashed and solid curves recalculated with the new K0.5 parameter show (arrows and labels) that maintaining glucose metabolism now requires about 6 ng/mL of plasma insulin, and nerve function requires at least 28 ng/mL of the hormone.
- Citation: Dobretsov M, Romanovsky D, Stimers JR. Early diabetic neuropathy: Triggers and mechanisms. World J Gastroenterol 2007; 13(2): 175-191
- URL: https://www.wjgnet.com/1007-9327/full/v13/i2/175.htm
- DOI: https://dx.doi.org/10.3748/wjg.v13.i2.175


