Copyright
©2007 Baishideng Publishing Group Co.
World J Gastroenterol. May 21, 2007; 13(19): 2717-2721
Published online May 21, 2007. doi: 10.3748/wjg.v13.i19.2717
Published online May 21, 2007. doi: 10.3748/wjg.v13.i19.2717
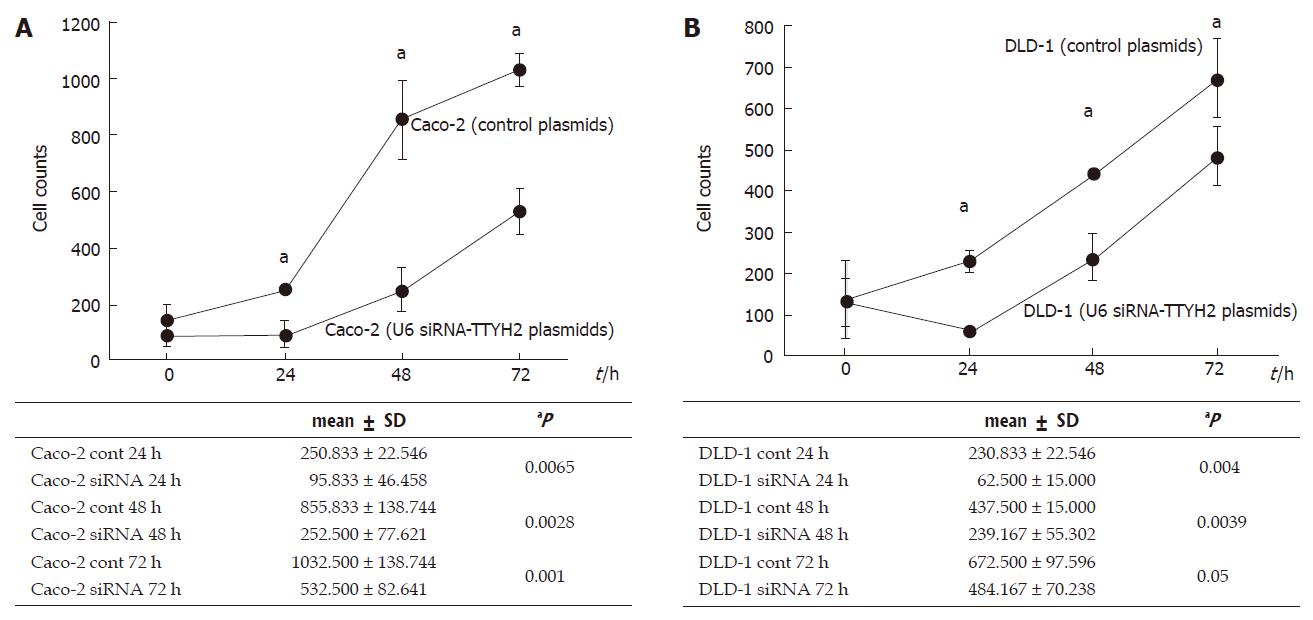
Figure 2 Growth kinetics of colon cancer cell lines (A: Caco-2, B: DLD-1) (U6 siRNA-TTYH2 plasmids) compared with control cell lines (control plasmids).
Growth curve plotted for cell number versus time of incubation (0 h, 24 h, 48 h and 72 h) of colon cancer cell line in vitro. The date indicated the mean ± SD of the experiments carried out in triplicate. aP < 0.05 vs control.
-
Citation: Toiyama Y, Mizoguchi A, Kimura K, Hiro J, Inoue Y, Tutumi T, Miki C, Kusunoki M. TTYH2, a human homologue of the
Drosophila melanogaster gene tweety, is up-regulated in colon carcinoma and involved in cell proliferation and cell aggregation. World J Gastroenterol 2007; 13(19): 2717-2721 - URL: https://www.wjgnet.com/1007-9327/full/v13/i19/2717.htm
- DOI: https://dx.doi.org/10.3748/wjg.v13.i19.2717


