Copyright
©2007 Baishideng Publishing Group Co.
World J Gastroenterol. Apr 21, 2007; 13(15): 2166-2173
Published online Apr 21, 2007. doi: 10.3748/wjg.v13.i15.2166
Published online Apr 21, 2007. doi: 10.3748/wjg.v13.i15.2166
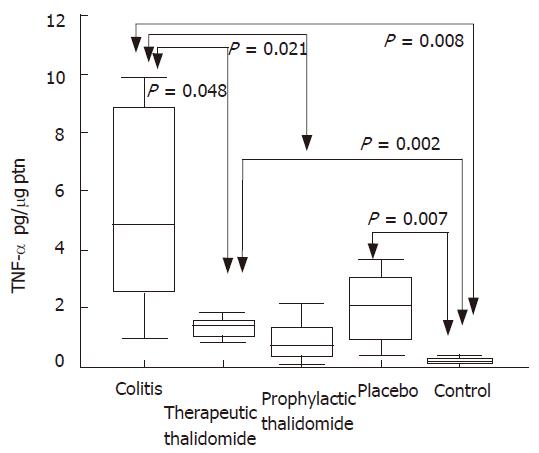
Figure 7 TNF-α production by the colonic mucosa.
Levels of TNF-α are measured in supernatants of organ cultures and presented as pg/μg of tissue protein, in the groups: untreated colitis, therapeutic- and prophylactic-thalidomide, placebo-treated, and normal controls, respectively (n = 10 in each group). Horizontal bars represent medians, boxes represent the 25th and 75th percentiles, and vertical bars represent ranges. Differences were analysed using one-way ANOVA with the Dunnett’s test for multiple comparisons. Significant differences are presented.
- Citation: Carvalho AT, Souza H, Carneiro AJ, Castelo-Branco M, Madi K, Schanaider A, Silva F, Pereira Jứnior FA, Pereira MG, Tortori C, Dines I, Carvalho J, Rocha E, Elia C. Therapeutic and prophylactic thalidomide in TNBS-induced colitis: Synergistic effects on TNF-α, IL-12 and VEGF production. World J Gastroenterol 2007; 13(15): 2166-2173
- URL: https://www.wjgnet.com/1007-9327/full/v13/i15/2166.htm
- DOI: https://dx.doi.org/10.3748/wjg.v13.i15.2166


