Copyright
©2007 Baishideng Publishing Group Co.
World J Gastroenterol. Apr 21, 2007; 13(15): 2160-2165
Published online Apr 21, 2007. doi: 10.3748/wjg.v13.i15.2160
Published online Apr 21, 2007. doi: 10.3748/wjg.v13.i15.2160
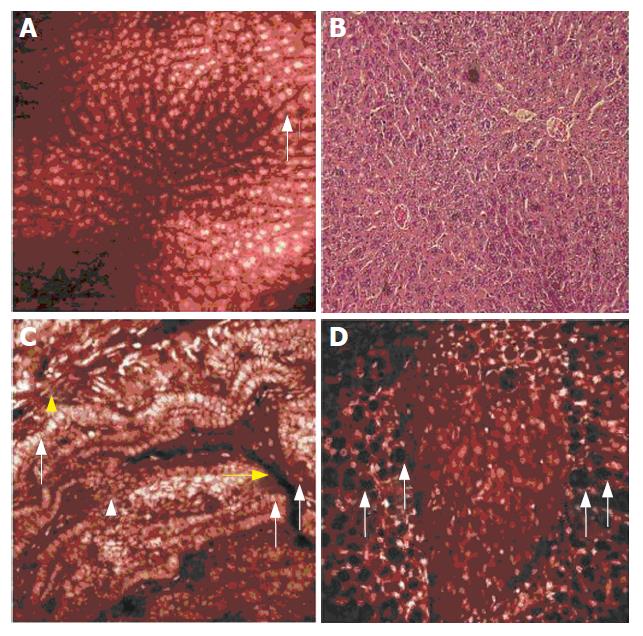
Figure 4 A: Hepatocyte nuclei stain bright after injection of acriflavine.
The cytoplasm is contrasted to a lesser extent, while the dye is completely removed from the sinusoids. Some hepatocytes show a distinct granular nuclear pattern (arrow), indicating nucleoli as uneven distribution of DNA within the nucleus; B: Corresponding liver specimen after H&E staining. Note that both sinusoids and central veins appear wider due to fixation artefacts; C: The complete gall bladder wall is visualized with acriflavine. Tall columnar cells line the folds at the luminal surface and are displayed at a transverse section (arrow) or en face (arrowhead). Vessel lumina can be identified by their endothelial lining (yellow arrows), and bands of smooth muscle cells are at the extraluminal tissue surface (yellow arrowhead); D: A patch of pancreatic tissue is visualized within the peripancreatic fatty tissue. The difference between the glandular parenchyma and the fat cells, which are identified by the black (fatty) intracellular inclusions (arrows) is apparent.
-
Citation: Goetz M, Memadathil B, Biesterfeld S, Schneider C, Gregor S, Galle PR, Neurath MF, Kiesslich R.
In vivo subsurface morphological and functional cellular and subcellular imaging of the gastrointestinal tract with confocal mini-microscopy. World J Gastroenterol 2007; 13(15): 2160-2165 - URL: https://www.wjgnet.com/1007-9327/full/v13/i15/2160.htm
- DOI: https://dx.doi.org/10.3748/wjg.v13.i15.2160


