Copyright
©2007 Baishideng Publishing Group Co.
World J Gastroenterol. Apr 7, 2007; 13(13): 1953-1961
Published online Apr 7, 2007. doi: 10.3748/wjg.v13.i13.1953
Published online Apr 7, 2007. doi: 10.3748/wjg.v13.i13.1953
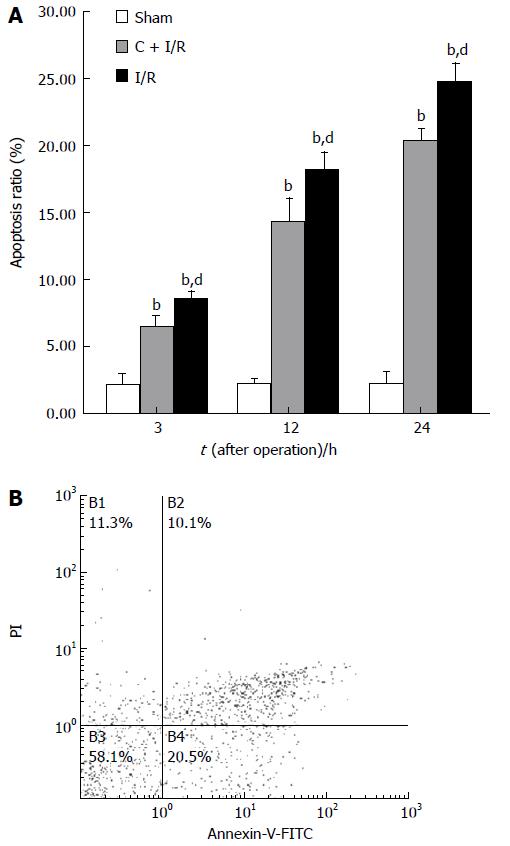
Figure 8 Apoptosis ratio (analyzed by flow cytometry method) in C + I/R group after liver reperfusion as compared with sham group (A) and I/R group (B).
bP < 0.01 vs sham group; dP < 0.01 vs C + I/R group. Error bars represent the 95% CI.
- Citation: Shen SQ, Zhang Y, Xiang JJ, Xiong CL. Protective effect of curcumin against liver warm ischemia/reperfusion injury in rat model is associated with regulation of heat shock protein and antioxidant enzymes. World J Gastroenterol 2007; 13(13): 1953-1961
- URL: https://www.wjgnet.com/1007-9327/full/v13/i13/1953.htm
- DOI: https://dx.doi.org/10.3748/wjg.v13.i13.1953


