Copyright
©2006 Baishideng Publishing Group Co.
World J Gastroenterol. Feb 21, 2006; 12(7): 1063-1070
Published online Feb 21, 2006. doi: 10.3748/wjg.v12.i7.1063
Published online Feb 21, 2006. doi: 10.3748/wjg.v12.i7.1063
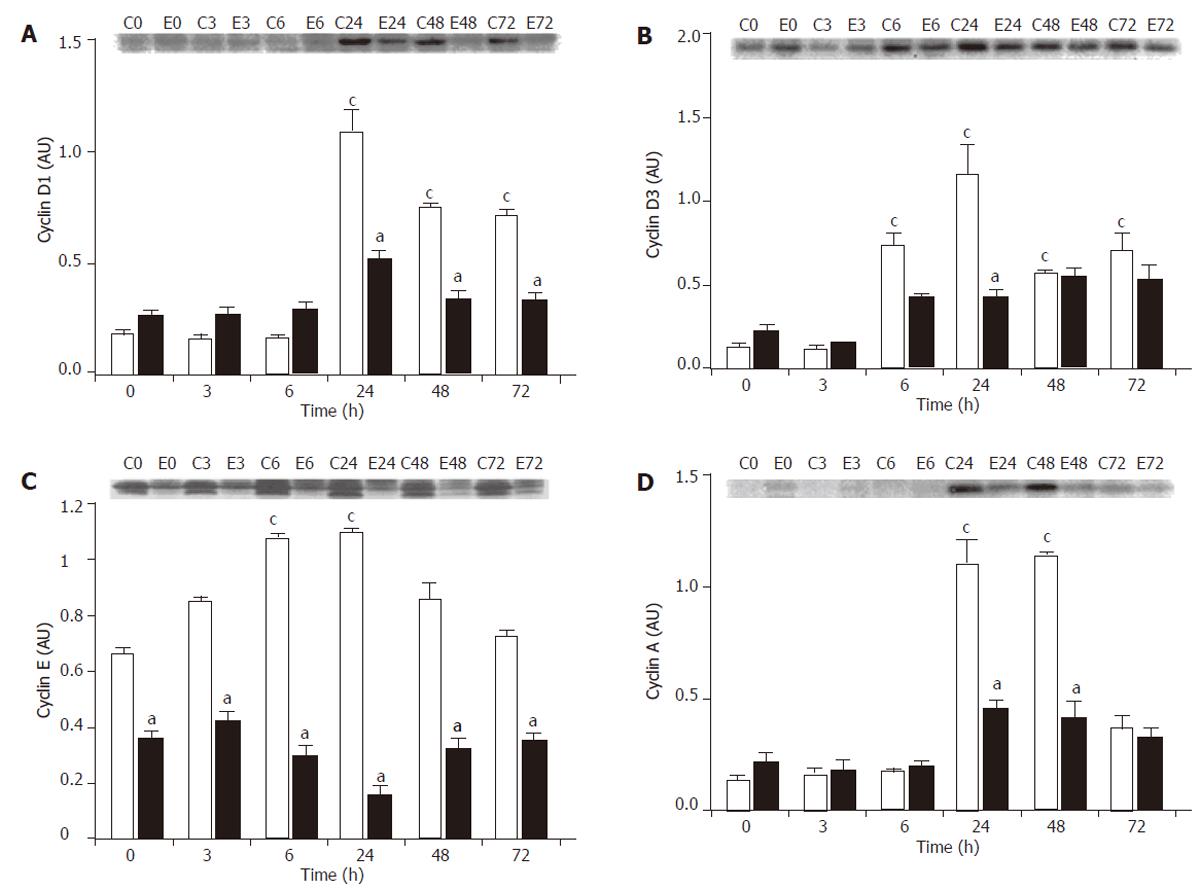
Figure 3 Effect of PH on cyclin expressions in healthy rats (white bars) and cirrhotic rats (black bars).
At different time points after the operation, the remnant liver was harvested, homogenized and the supernatant was used for analysis. For each time point, the supernatant from 6 animals was pooled and used for Western blot analysis. The blot image was captured and the bands were quantified using the Analytical Imaging Station software. All analyses were carried out in triplicates. A representative blot (C, control, healthy rats; E, cirrhotic rats; the number indicates the time post-PH in h) and the quantification analysis expressed as mean+SE (AU = arbitrary units) are shown. A: Cyclin D1 expression. B: Cyclin D3 expression. C: Cyclin E expression. D: Cyclin A expression. cP < 0.05, ANOVA analysis, for comparison between control rats before (at 0 h) and after PH. aP < 0.05, ANOVA analysis, for comparison between the cirrhotic group and the corresponding control group at each time point.
- Citation: Yang S, Leow CK, Tan TMC. Expression patterns of cytokine, growth factor and cell cycle-related genes after partial hepatectomy in rats with thioacetamide-induced cirrhosis. World J Gastroenterol 2006; 12(7): 1063-1070
- URL: https://www.wjgnet.com/1007-9327/full/v12/i7/1063.htm
- DOI: https://dx.doi.org/10.3748/wjg.v12.i7.1063


