Copyright
©2006 Baishideng Publishing Group Co.
World J Gastroenterol. Feb 14, 2006; 12(6): 928-934
Published online Feb 14, 2006. doi: 10.3748/wjg.v12.i6.928
Published online Feb 14, 2006. doi: 10.3748/wjg.v12.i6.928
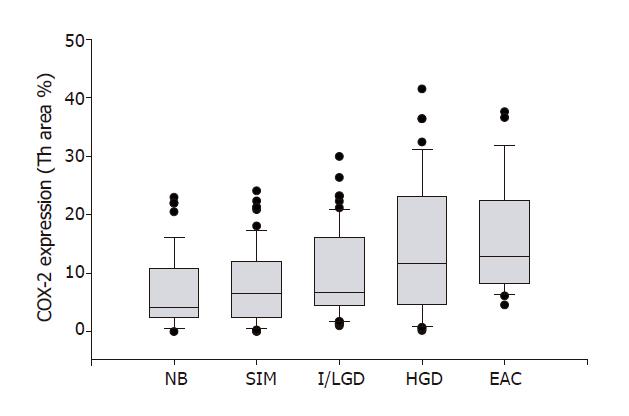
Figure 3 COX-2 expression and pathological severity of BE.
COX-2 expression is plotted against the 4 stages of Barrett's esophagus. The line enclosed within the box represents the median value; the small circles indicate outlying data points. COX-2 expression in specimens with SIM, I/LGD, HGD and EAC was significantly increased in comparison with that in NB (P < 0.01). A significant positive correlation between COX-2 expression and histopathologic changes from SIM to EAC was observed (r = 0.97, P < 0.001).
- Citation: Li Y, Wo JM, Ray MB, Jones W, Su RR, Ellis S, Martin RCG. Cyclooxygenase-2 and epithelial growth factor receptor up-regulation during progression of Barrett’s esophagus to adenocarcinoma. World J Gastroenterol 2006; 12(6): 928-934
- URL: https://www.wjgnet.com/1007-9327/full/v12/i6/928.htm
- DOI: https://dx.doi.org/10.3748/wjg.v12.i6.928


