Copyright
©2006 Baishideng Publishing Group Co.
World J Gastroenterol. Feb 14, 2006; 12(6): 921-927
Published online Feb 14, 2006. doi: 10.3748/wjg.v12.i6.921
Published online Feb 14, 2006. doi: 10.3748/wjg.v12.i6.921
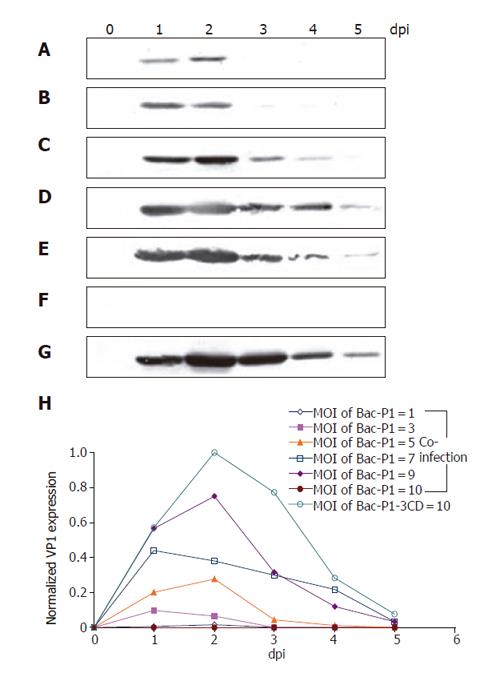
Figure 3 Time course profiles of VP1 production under various infection conditions as analyzed by Western blot.
Insect cells were infected at a total MOI of 10 by single infection with Bac-P1-3CD (G), or co-infection at MOI ratios (Bac-P1/Bac-3CD) of 1/9 (b), 3/7 (B), 5/5 (C), 7/3 (D), 9/1 (E) and 10/0 (F). Lanes 0-5 represent the cell lysates collected at 0, 1, 2, 3, 4, and 5 dpi, respectively. The relative VP1 production levels under different conditions were quantified by scanning densitometry (H). The data represent the average values of duplicated experiments.
- Citation: Chung YC, Huang JH, Lai CW, Sheng HC, Shih SR, Ho MS, Hu YC. Expression, purification and characterization of enterovirus-71 virus-like particles. World J Gastroenterol 2006; 12(6): 921-927
- URL: https://www.wjgnet.com/1007-9327/full/v12/i6/921.htm
- DOI: https://dx.doi.org/10.3748/wjg.v12.i6.921


