Copyright
©2006 Baishideng Publishing Group Co.
World J Gastroenterol. Feb 14, 2006; 12(6): 885-895
Published online Feb 14, 2006. doi: 10.3748/wjg.v12.i6.885
Published online Feb 14, 2006. doi: 10.3748/wjg.v12.i6.885
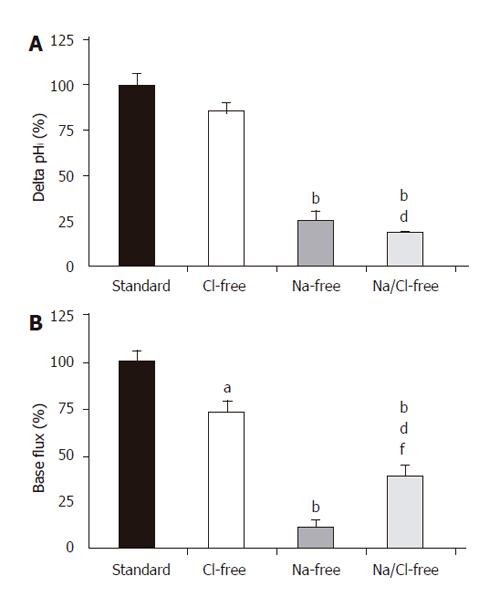
Figure 4 Basolateral HCO3– uptake – changes in (A) ∆pHi and (B) J(B) caused by the withdrawal of Cl– and/or Na+.
SE of the control groups (standard, black bar) is somewhat different for each of the respective ion-withdrawal groups. The SEs depicted on the standard bars are the maximum values observed. aP<0.05 and bP<0.01 vs control group dP<0.01 vs Cl–-free group and/or fP<0.01 vs Na+-free group.
- Citation: Jr ZR, Fearn A, Hegyi P, Boros I, Gray MA, Argent BE. Characterization of H+ and HCO3- transporters in CFPAC-1 human pancreatic duct cells. World J Gastroenterol 2006; 12(6): 885-895
- URL: https://www.wjgnet.com/1007-9327/full/v12/i6/885.htm
- DOI: https://dx.doi.org/10.3748/wjg.v12.i6.885


