Copyright
©2006 Baishideng Publishing Group Co.
World J Gastroenterol. Feb 7, 2006; 12(5): 697-702
Published online Feb 7, 2006. doi: 10.3748/wjg.v12.i5.697
Published online Feb 7, 2006. doi: 10.3748/wjg.v12.i5.697
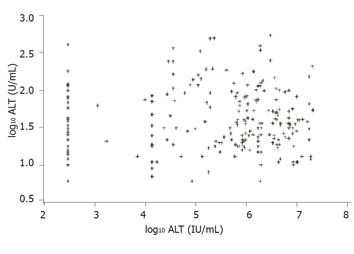
Figure 2 Correlation of HCV-RNA level in serum with ALT activity.
Scatter plot with HCV-RNA concentrations on the y-axis and ALT activity on the x-axis, both on log10-scale.
-
Citation: Hilgard P, Kahraman A, Lehmann N, Seltmann C, Beckebaum S, Ross RS, Baba HA, Malago M, Broelsch CE, Gerken G. Cyclosporine
versus tacrolimus in patients with HCV infection after liver transplantation: Effects on virus replication and recurrent hepatitis. World J Gastroenterol 2006; 12(5): 697-702 - URL: https://www.wjgnet.com/1007-9327/full/v12/i5/697.htm
- DOI: https://dx.doi.org/10.3748/wjg.v12.i5.697


