Copyright
©2006 Baishideng Publishing Group Co.
World J Gastroenterol. Dec 28, 2006; 12(48): 7878-7883
Published online Dec 28, 2006. doi: 10.3748/wjg.v12.i48.7878
Published online Dec 28, 2006. doi: 10.3748/wjg.v12.i48.7878
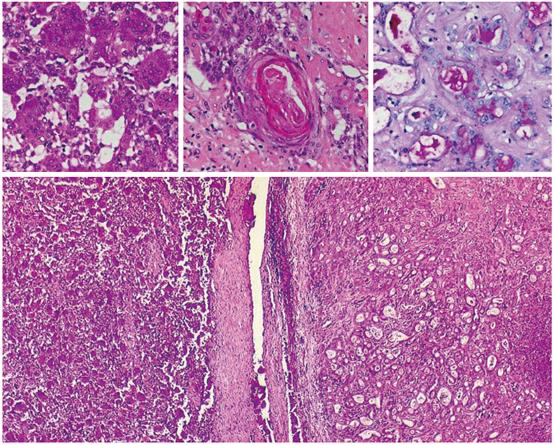
Figure 2 Histology (HE, x 20-40) of OGCT of the liver with a mixed cell population of osteoclastic giant cells and pleomorphic mononuclear cells (left), adenocarcinomatous component with mucinous inclusions (PAS, upper right) and squamous cell differentiation (middle).
- Citation: Bauditz J, Rudolph B, Wermke W. Osteoclast-like giant cell tumors of the pancreas and liver. World J Gastroenterol 2006; 12(48): 7878-7883
- URL: https://www.wjgnet.com/1007-9327/full/v12/i48/7878.htm
- DOI: https://dx.doi.org/10.3748/wjg.v12.i48.7878


