Copyright
©2006 Baishideng Publishing Group Co.
World J Gastroenterol. Dec 28, 2006; 12(48): 7852-7858
Published online Dec 28, 2006. doi: 10.3748/wjg.v12.i48.7852
Published online Dec 28, 2006. doi: 10.3748/wjg.v12.i48.7852
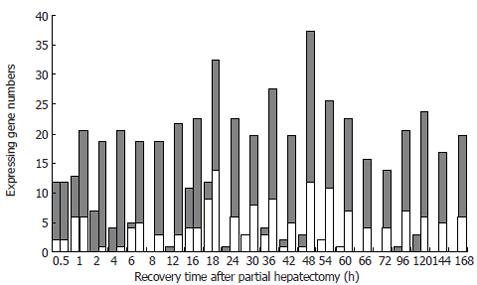
Figure 2 Initial and total expression profiles of 85 innate immune response-associated genes at each time point of liver regeneration.
Grey bars: up-regulated expression gene; white bars: down-regulated expression gene; blank bars: initially expressed genes in which up-regulated genes are predominant in the forepart, and down-regulated genes in the prophase and metaphase, whereas very few in the anaphase; dotted bars: the total number of expressed genes, in which the expression of some genes is up-regulated and the expression of others is down-regulated during LR.
- Citation: Chen GW, Zhang MZ, Zhao LF, Xu CS. Expression patterns and action analysis of genes associated with physiological responses during rat liver regeneration: Innate immune response. World J Gastroenterol 2006; 12(48): 7852-7858
- URL: https://www.wjgnet.com/1007-9327/full/v12/i48/7852.htm
- DOI: https://dx.doi.org/10.3748/wjg.v12.i48.7852


