Copyright
©2006 Baishideng Publishing Group Co.
World J Gastroenterol. Dec 28, 2006; 12(48): 7852-7858
Published online Dec 28, 2006. doi: 10.3748/wjg.v12.i48.7852
Published online Dec 28, 2006. doi: 10.3748/wjg.v12.i48.7852
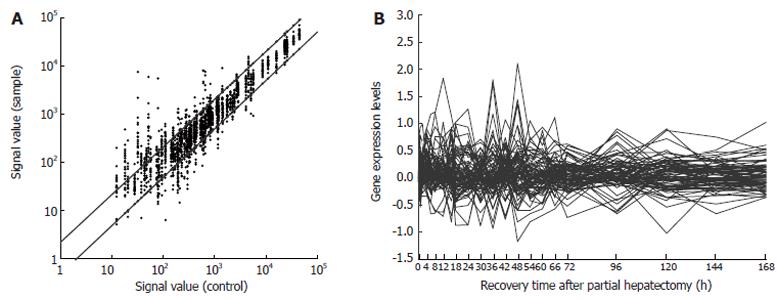
Figure 1 Expression frequency (A) and changes (B) of 85 innate immune response-associated genes during rat liver regeneration.
Data detected by rat genome 230 2.0 array were analyzed and graphed by Microsoft Excel. The dots above bias indicate that the expression of genes was increased more than two folds and up-regulated 350 times, the dots under bias indicate that the expression of genes was decreased more than two folds and down-regulated 129 times, the dots between biases indicate that the expression of genes has no alteration. The expression of 59 genes was increased 2-128 folds, while the expression of 44 genes was increased 2-10 folds.
- Citation: Chen GW, Zhang MZ, Zhao LF, Xu CS. Expression patterns and action analysis of genes associated with physiological responses during rat liver regeneration: Innate immune response. World J Gastroenterol 2006; 12(48): 7852-7858
- URL: https://www.wjgnet.com/1007-9327/full/v12/i48/7852.htm
- DOI: https://dx.doi.org/10.3748/wjg.v12.i48.7852


