Copyright
©2006 Baishideng Publishing Group Co.
World J Gastroenterol. Dec 21, 2006; 12(47): 7621-7625
Published online Dec 21, 2006. doi: 10.3748/wjg.v12.i47.7621
Published online Dec 21, 2006. doi: 10.3748/wjg.v12.i47.7621
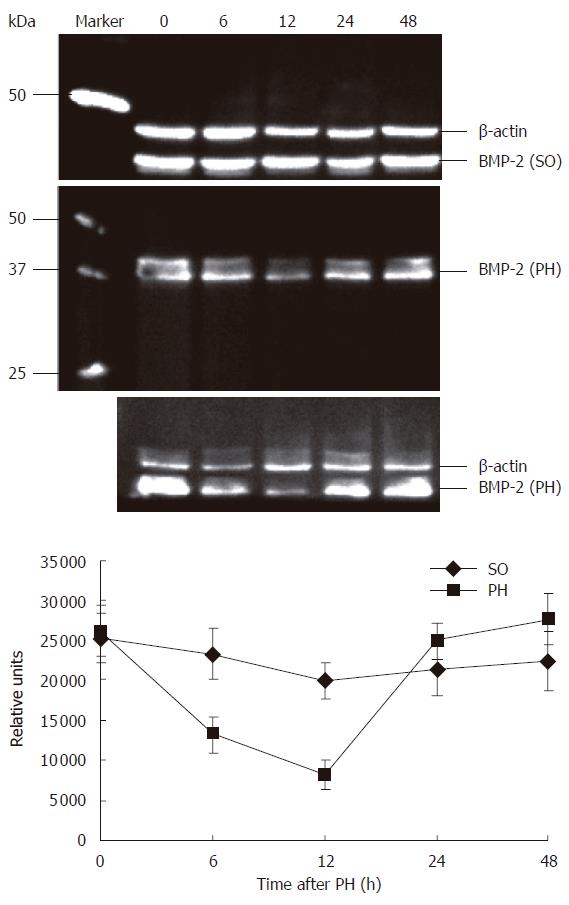
Figure 2 Immunoblot for BMP-2 in rat liver of NC, SO and PH groups.
At all the time points (note: 0 h = NC), rat liver extracts tested showed a band at approximately 37 kDa on the immunoblots. Bio-Rad Precision Protein Standards were used. Equal protein loading was confirmed using β-actin antibodies on the same blots by striping the old antibodies in strip buffer. The calculated molecular weights are shown. Quantification of 12 h immunoblots revealed 3.22 fold lower (P < 0.01) BMP-2 protein expression levels in PH group as compared with NC group. BMP-2 protein levels increased progressively to that of NC group at 48 h after PH.
- Citation: Xu CP, Ji WM, Brink GRVD, Peppelenbosch MP. Bone morphogenetic protein-2 is a negative regulator of hepatocyte proliferation downregulated in the regenerating liver. World J Gastroenterol 2006; 12(47): 7621-7625
- URL: https://www.wjgnet.com/1007-9327/full/v12/i47/7621.htm
- DOI: https://dx.doi.org/10.3748/wjg.v12.i47.7621


