Copyright
©2006 Baishideng Publishing Group Co.
World J Gastroenterol. Dec 21, 2006; 12(47): 7604-7612
Published online Dec 21, 2006. doi: 10.3748/wjg.v12.i47.7604
Published online Dec 21, 2006. doi: 10.3748/wjg.v12.i47.7604
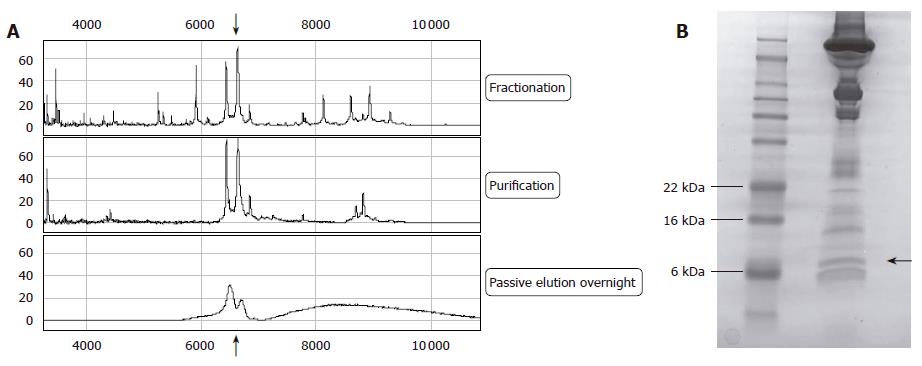
Figure 4 Isolation of the 6.
6 kDa peak. First line shows spectrum after fractionation of the sample with Q Ceramic HyperD®F spin columns, the second line shows the spectra after purification using reverse phase chromatography. The last line spectra represent the purified biomarker on a NP20 array after SDS-gel purification and passive elution. The arrow indicates the 6.6 kDa peak (A); One-dimensional SDS polyacrylamide gel electrophoresis after staining of enriched sample (second lane). First lane: molecular marker proteins (See Blue® Plus2, Invitrogen, Carlsbad, USA). The arrow indicates the 6.6 kDa protein (B).
- Citation: Göbel T, Vorderwülbecke S, Hauck K, Fey H, Häussinger D, Erhardt A. New multi protein patterns differentiate liver fibrosis stages and hepatocellular carcinoma in chronic hepatitis C serum samples. World J Gastroenterol 2006; 12(47): 7604-7612
- URL: https://www.wjgnet.com/1007-9327/full/v12/i47/7604.htm
- DOI: https://dx.doi.org/10.3748/wjg.v12.i47.7604


