Copyright
©2006 Baishideng Publishing Group Co.
World J Gastroenterol. Dec 7, 2006; 12(45): 7285-7291
Published online Dec 7, 2006. doi: 10.3748/wjg.v12.i45.7285
Published online Dec 7, 2006. doi: 10.3748/wjg.v12.i45.7285
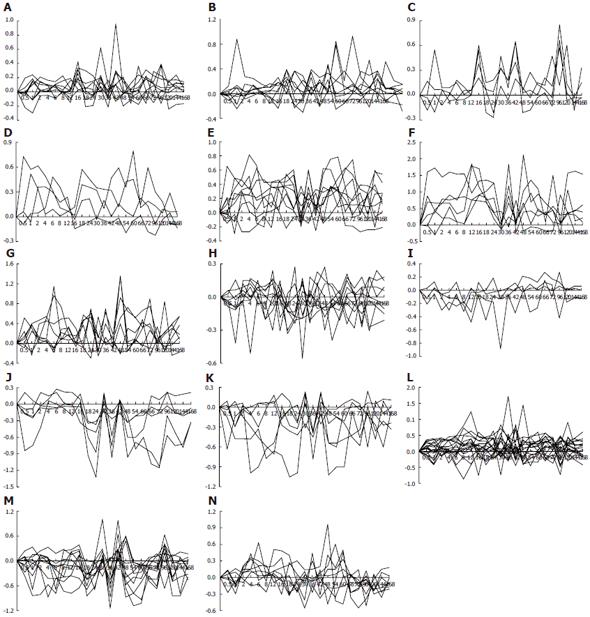
Figure 4 Gene expression patterns of 107 genes associated with responses to chemical substances during LR.
Twenty-six expression patterns were obtained by analysis of data detection of Rat Genome 230 2.0 array with Microsoft Excel. A-G: 47 up-regulated genes; H-K: 24 down-regulated genes; L-N: 36 up/down-regulated genes. X-axis represents recovery time after PH (h); Y-axis shows logarithm ratio of signal values of genes at each time point vs control.
- Citation: Qin SW, Zhao LF, Chen XG, Xu CS. Expression pattern and action analysis of genes associated with the responses to chemical stimuli during rat liver regeneration. World J Gastroenterol 2006; 12(45): 7285-7291
- URL: https://www.wjgnet.com/1007-9327/full/v12/i45/7285.htm
- DOI: https://dx.doi.org/10.3748/wjg.v12.i45.7285


