Copyright
©2006 Baishideng Publishing Group Co.
World J Gastroenterol. Dec 7, 2006; 12(45): 7285-7291
Published online Dec 7, 2006. doi: 10.3748/wjg.v12.i45.7285
Published online Dec 7, 2006. doi: 10.3748/wjg.v12.i45.7285
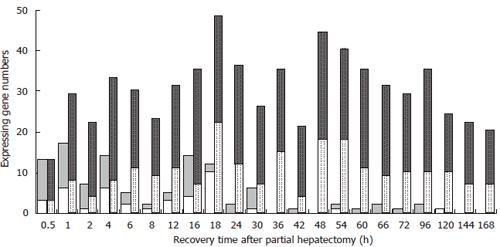
Figure 2 The initial and total expression profiles of 107 genes associated with responses to chemical substances at each time point of liver regeneration.
Grey bars: up-regulated genes; White bars: down-regulated genes. Blank bars represent initially expressing genes, in which up-regulation genes are predominantly in the forepart, prophase and early metaphase, and few genes initially expressed in the metaphase, early anaphase and middle anaphase, whereas no initial expression in the late anaphase. Dotted bars represent the total expressing genes, in which some genes are up-expressed, and the others down-expressed during LR.
- Citation: Qin SW, Zhao LF, Chen XG, Xu CS. Expression pattern and action analysis of genes associated with the responses to chemical stimuli during rat liver regeneration. World J Gastroenterol 2006; 12(45): 7285-7291
- URL: https://www.wjgnet.com/1007-9327/full/v12/i45/7285.htm
- DOI: https://dx.doi.org/10.3748/wjg.v12.i45.7285


