Copyright
©2006 Baishideng Publishing Group Co.
World J Gastroenterol. Nov 28, 2006; 12(44): 7113-7117
Published online Nov 28, 2006. doi: 10.3748/wjg.v12.i44.7113
Published online Nov 28, 2006. doi: 10.3748/wjg.v12.i44.7113
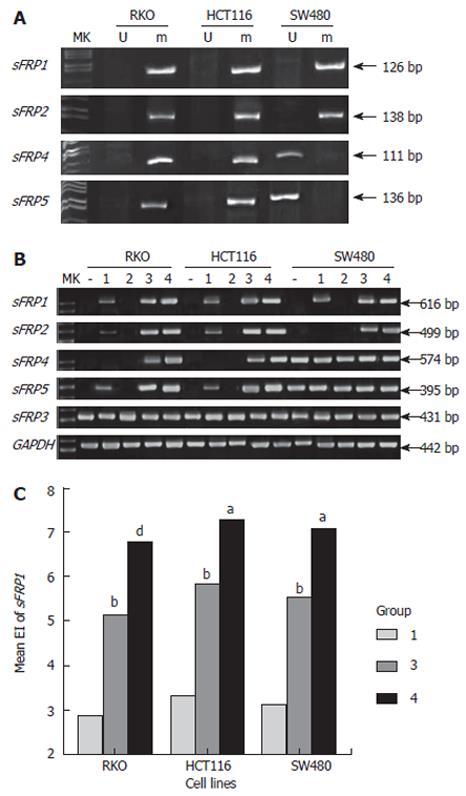
Figure 4 A: Hypermethylation of sFRP genes in colorectal cancer cell lines; B: The mRNA expression level of sFRP genes in colorectal cancer cell lines before and after demethylation treatment.
Three cell lines all received 4 different treatments: never treated (-), low-dose DAC (1), TSA (2), high-dose DAC (3), DAC + TSA (4); C: The sFRP1 gene expression index (EI) in three cell lines after demethylation treatment, low-dose DAC (1), high-dose DAC (3), DAC+TSA (4). bP < 0.01 vs 1, dP < 0.01 vs 3, aP < 0.05 vs 3.
- Citation: Qi J, Zhu YQ, Luo J, Tao WH. Hypermethylation and expression regulation of secreted frizzled-related protein genes in colorectal tumor. World J Gastroenterol 2006; 12(44): 7113-7117
- URL: https://www.wjgnet.com/1007-9327/full/v12/i44/7113.htm
- DOI: https://dx.doi.org/10.3748/wjg.v12.i44.7113


