Copyright
©2006 Baishideng Publishing Group Co.
World J Gastroenterol. Nov 28, 2006; 12(44): 7104-7112
Published online Nov 28, 2006. doi: 10.3748/wjg.v12.i44.7104
Published online Nov 28, 2006. doi: 10.3748/wjg.v12.i44.7104
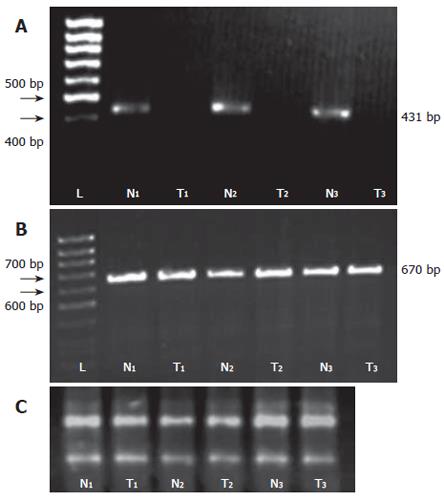
Figure 3 A: Verifying differential expression pattern of ß tropomyosin by RT-PCR in three separate experiments as indicated by numbers (1 to 3), normal versus tumor tissues.
The amplification product (431bp) is limited to normal tissue which indicates loss or strong down regulation of this protein as observed by 2DE; B: RT-PCR amplification of ß-actin as an internal control of RT-PCR; C: Electrophoresis of the total RNA from normal and tumor tissues used for cDNA synthesis and RT-PCR. L: DNA marker; N: normal tissue; T: tumor tissue.
- Citation: Jazii FR, Najafi Z, Malekzadeh R, Conrads TP, Ziaee AA, Abnet C, Yazdznbod M, Karkhane AA, Salekdeh GH. Identification of squamous cell carcinoma associated proteins by proteomics and loss of beta tropomyosin expression in esophageal cancer. World J Gastroenterol 2006; 12(44): 7104-7112
- URL: https://www.wjgnet.com/1007-9327/full/v12/i44/7104.htm
- DOI: https://dx.doi.org/10.3748/wjg.v12.i44.7104


