Copyright
©2006 Baishideng Publishing Group Co.
World J Gastroenterol. Nov 21, 2006; 12(43): 6966-6972
Published online Nov 21, 2006. doi: 10.3748/wjg.v12.i43.6966
Published online Nov 21, 2006. doi: 10.3748/wjg.v12.i43.6966
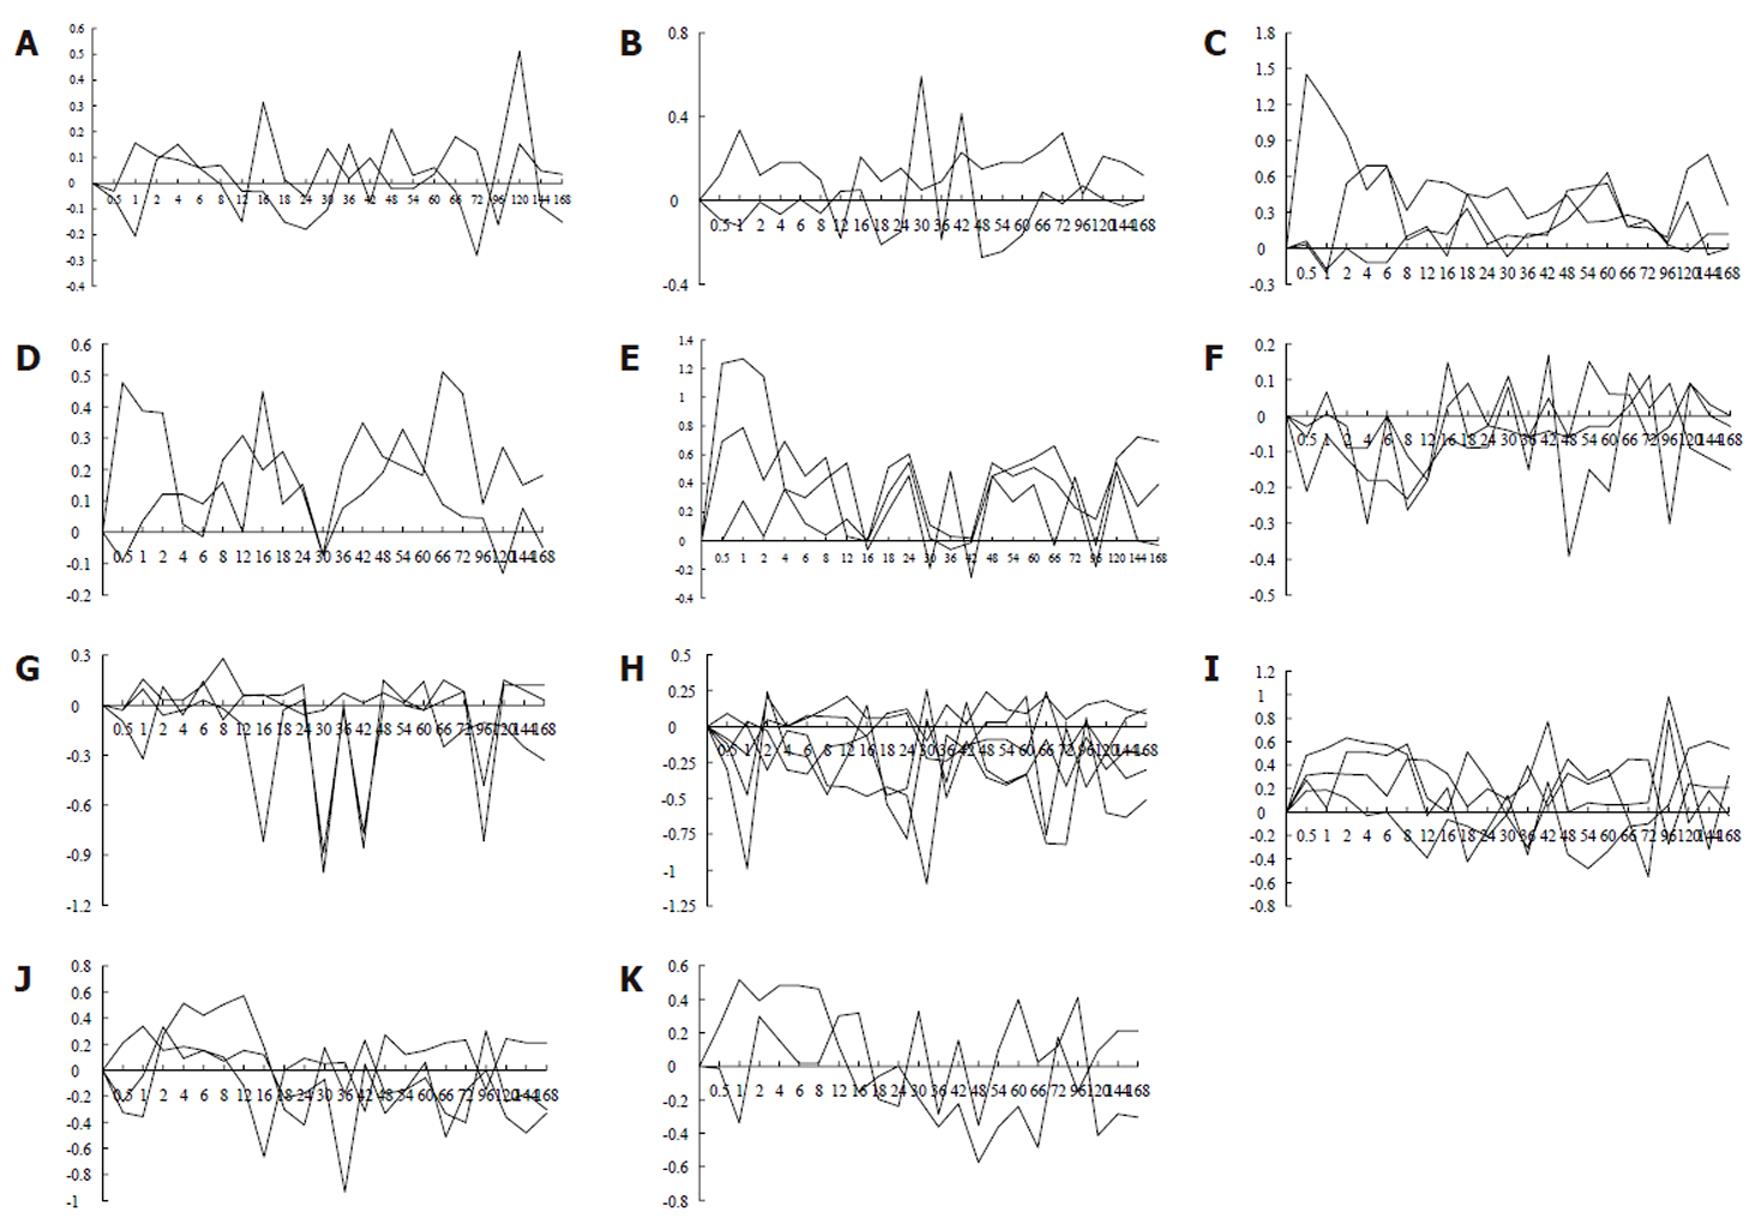
Figure 4 Expression patterns of 32 genes associated with drug-induced liver diseases during liver regeneration.
These genes exhibit 20 types of expression patterns. A-E: Up-regulation in expression; F-H: Down-regulation; I-J: Up/down-regulation mixed. X-axis represents recovery time after PH (h), Y-axis shows logarithm ratio of the signal values of genes at each time point to the control.
- Citation: Ning QJ, Qin SW, Xu CS. Expression patterns and action analysis of genes associated with drug-induced liver diseases during rat liver regeneration. World J Gastroenterol 2006; 12(43): 6966-6972
- URL: https://www.wjgnet.com/1007-9327/full/v12/i43/6966.htm
- DOI: https://dx.doi.org/10.3748/wjg.v12.i43.6966


