Copyright
©2006 Baishideng Publishing Group Co.
World J Gastroenterol. Nov 21, 2006; 12(43): 6966-6972
Published online Nov 21, 2006. doi: 10.3748/wjg.v12.i43.6966
Published online Nov 21, 2006. doi: 10.3748/wjg.v12.i43.6966
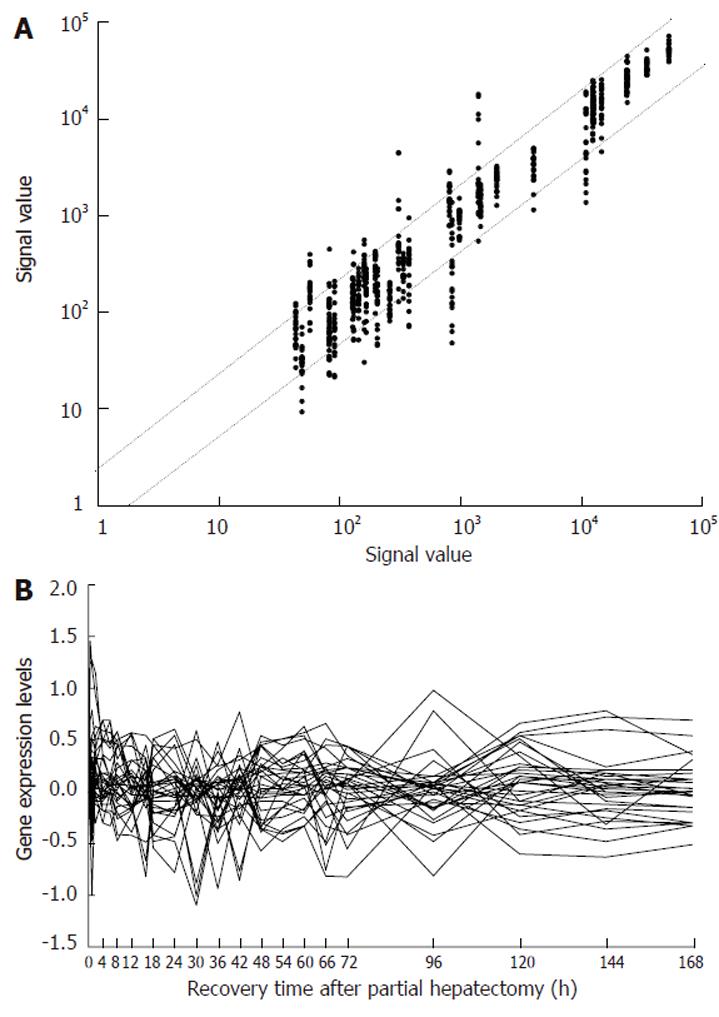
Figure 1 Expression profiles of 32 genes associated with drug-induced liver diseases during liver regeneration.
A: The abundance and frequency of gene expression, each point represents the signal value of one gene at corresponding time point. The dots above bias represent the genes up-regulated by more than twofold, those under bias represent the genes down-regulated by more than twofold, and the ones between biases represent the genes meaningless alteration in expression. The farer the genes from the bias, the greater the folds of gene change; B: The expression changes of genes associated with LR.
- Citation: Ning QJ, Qin SW, Xu CS. Expression patterns and action analysis of genes associated with drug-induced liver diseases during rat liver regeneration. World J Gastroenterol 2006; 12(43): 6966-6972
- URL: https://www.wjgnet.com/1007-9327/full/v12/i43/6966.htm
- DOI: https://dx.doi.org/10.3748/wjg.v12.i43.6966


