Copyright
©2006 Baishideng Publishing Group Co.
World J Gastroenterol. Oct 28, 2006; 12(40): 6473-6499
Published online Oct 28, 2006. doi: 10.3748/wjg.v12.i40.6473
Published online Oct 28, 2006. doi: 10.3748/wjg.v12.i40.6473
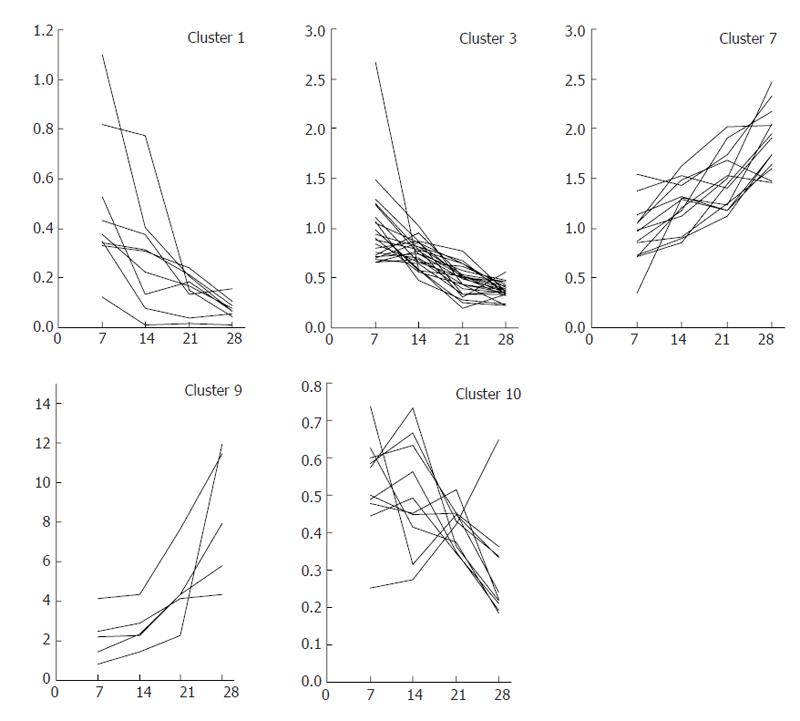
Figure 7 Cluster of genes that increased or decreased in expression with progression of fibrogenesis.
Gene expression profiles in the chronic phase (d 7, 14, 21 and 28) were clustered into 10 patterns using K-means analysis. Clustered genes with a tendency to temporally decrease (clusters 1, 3 and 10) or increase (clusters 7 and 9) were selected as gene markers that had a strong relationship with fibrogenesis.
- Citation: Takahara Y, Takahashi M, Wagatsuma H, Yokoya F, Zhang QW, Yamaguchi M, Aburatani H, Kawada N. Gene expression profiles of hepatic cell-type specific marker genes in progression of liver fibrosis. World J Gastroenterol 2006; 12(40): 6473-6499
- URL: https://www.wjgnet.com/1007-9327/full/v12/i40/6473.htm
- DOI: https://dx.doi.org/10.3748/wjg.v12.i40.6473


