Copyright
©2006 Baishideng Publishing Group Co.
World J Gastroenterol. Oct 28, 2006; 12(40): 6473-6499
Published online Oct 28, 2006. doi: 10.3748/wjg.v12.i40.6473
Published online Oct 28, 2006. doi: 10.3748/wjg.v12.i40.6473
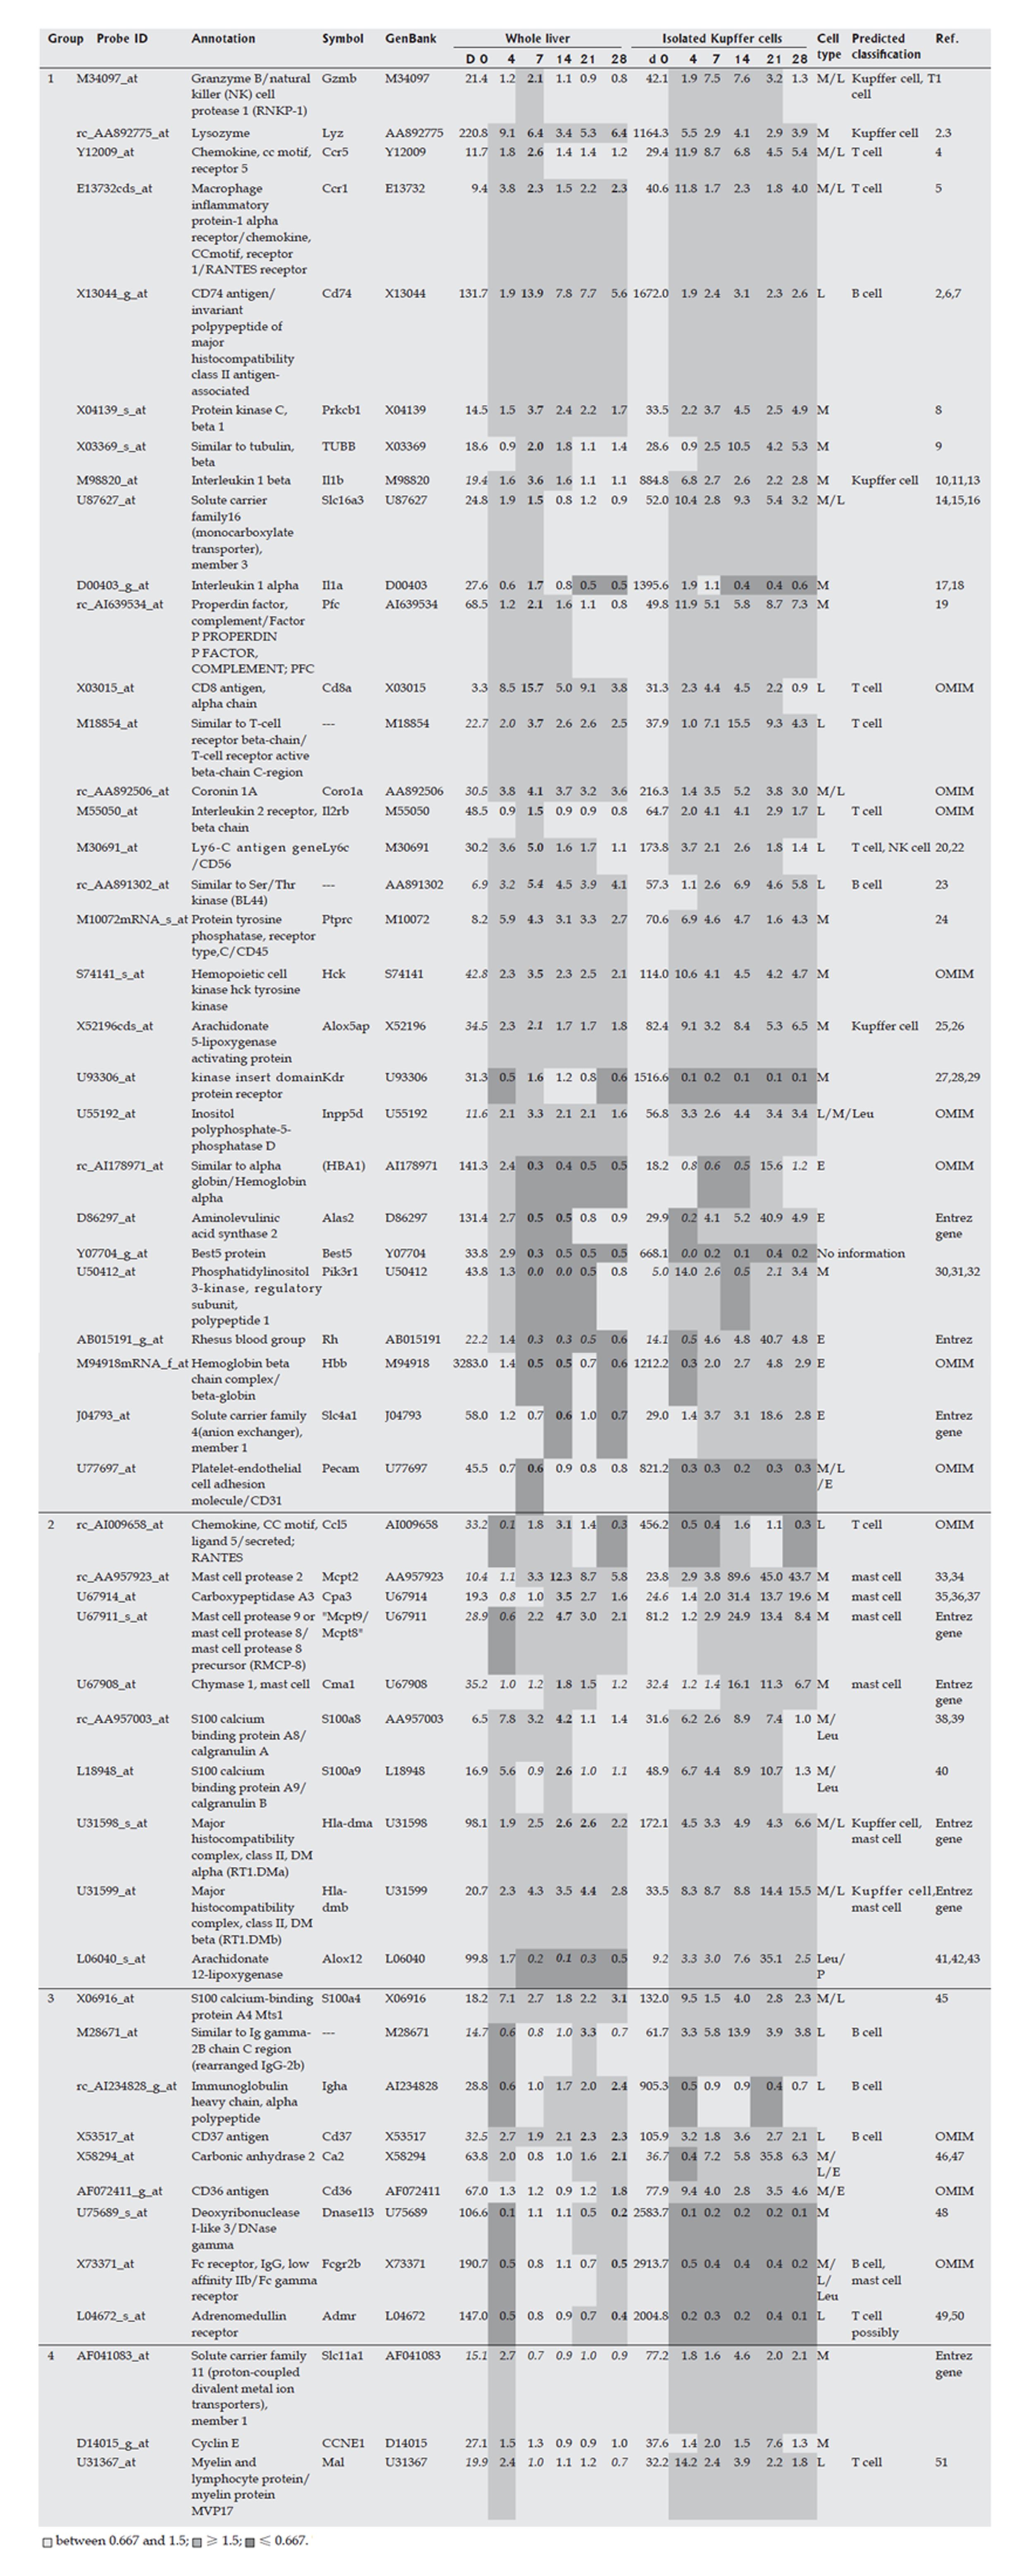
Figure 5 Marker genes in hematopoietic cells in the Kupffer cell fraction.
Expression profiles of the whole liver and the isolated Kupffer cell fraction during fibrogenesis were obtained using a rat Genome U34A Array (Affymetrix). Marker genes of hematopoietic cells in the Kupffer cell fraction are listed. Expression intensities are shown for d 0, and the expression intensity data for d 4, 7, 14, 21 and 28 are displayed as ratios to the d 0 expression levels. Italics indicate an “absent” call by the Affymetrix software. Bold values indicate the highest or lowest ratio in the chronic phase (d 7, 14, 21 and 28). The cell types in the infl ammatory cell fraction are as follows: M: Monocytes and their progenitors; L: Lymphocytes and their progenitors; E: Erythrocytes and their progenitors; P: Platelets and their progenitors; Leu: Other kinds of leukocytes and their progenitors.
- Citation: Takahara Y, Takahashi M, Wagatsuma H, Yokoya F, Zhang QW, Yamaguchi M, Aburatani H, Kawada N. Gene expression profiles of hepatic cell-type specific marker genes in progression of liver fibrosis. World J Gastroenterol 2006; 12(40): 6473-6499
- URL: https://www.wjgnet.com/1007-9327/full/v12/i40/6473.htm
- DOI: https://dx.doi.org/10.3748/wjg.v12.i40.6473


