Copyright
©2006 Baishideng Publishing Group Co.
World J Gastroenterol. Oct 28, 2006; 12(40): 6464-6472
Published online Oct 28, 2006. doi: 10.3748/wjg.v12.i40.6464
Published online Oct 28, 2006. doi: 10.3748/wjg.v12.i40.6464
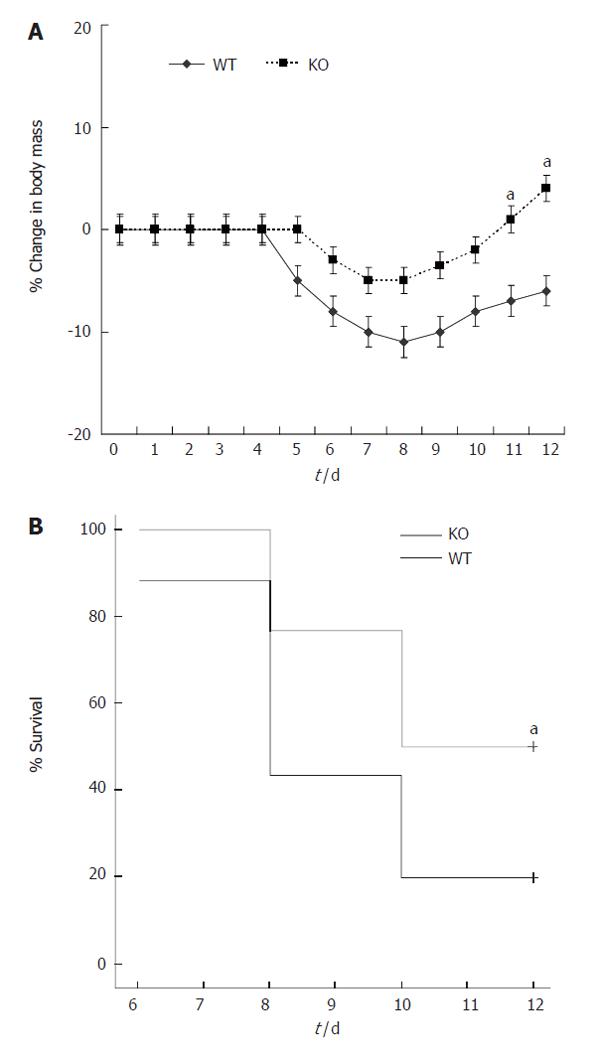
Figure 7 A: Percentage of body weight change during DSS-induced colitis in wild-type (WT) and deficient (KO) animals (n = 30 in each group).
Values are mean ± SE of percentage body weight change in each animal relative to weight at the start of DSS treatment. WT animals showed more weight loss than deficient mice (aP < 0.05). B: Survival curve of both colitic groups. The mortality was significantly higher in wt animals compared to deficient mice (aP = 0.015).
- Citation: Santana A, Medina C, Paz-Cabrera MC, Díaz-Gonzalez F, Farré E, Salas A, Radomski MW, Quintero E. Attenuation of dextran sodium sulphate induced colitis in matrix metalloproteinase-9 deficient mice. World J Gastroenterol 2006; 12(40): 6464-6472
- URL: https://www.wjgnet.com/1007-9327/full/v12/i40/6464.htm
- DOI: https://dx.doi.org/10.3748/wjg.v12.i40.6464


