Copyright
©2006 Baishideng Publishing Group Co.
World J Gastroenterol. Jan 28, 2006; 12(4): 526-538
Published online Jan 28, 2006. doi: 10.3748/wjg.v12.i4.526
Published online Jan 28, 2006. doi: 10.3748/wjg.v12.i4.526
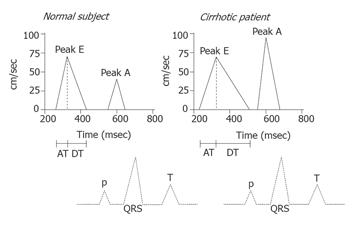
Figure 3 Diagram of the transmitral Doppler flow signal in the healthy state and in a patient with cirrhosis.
The Doppler flow profile reflects the early filling of the ventricle (Peak E) and the late atrial contribution to its filling (Peak A). A decrease in the E/A ratio and prolonged acceleration time (AT) and deceleration time (DT) indicate diastolic dysfunction, as illustrated in the right panel. The broken lines are the time-related electrocardiogram.
- Citation: Møller S, Henriksen JH. Cardiopulmonary complications in chronic liver disease. World J Gastroenterol 2006; 12(4): 526-538
- URL: https://www.wjgnet.com/1007-9327/full/v12/i4/526.htm
- DOI: https://dx.doi.org/10.3748/wjg.v12.i4.526


