Copyright
©2006 Baishideng Publishing Group Co.
World J Gastroenterol. Oct 7, 2006; 12(37): 6008-6016
Published online Oct 7, 2006. doi: 10.3748/wjg.v12.i37.6008
Published online Oct 7, 2006. doi: 10.3748/wjg.v12.i37.6008
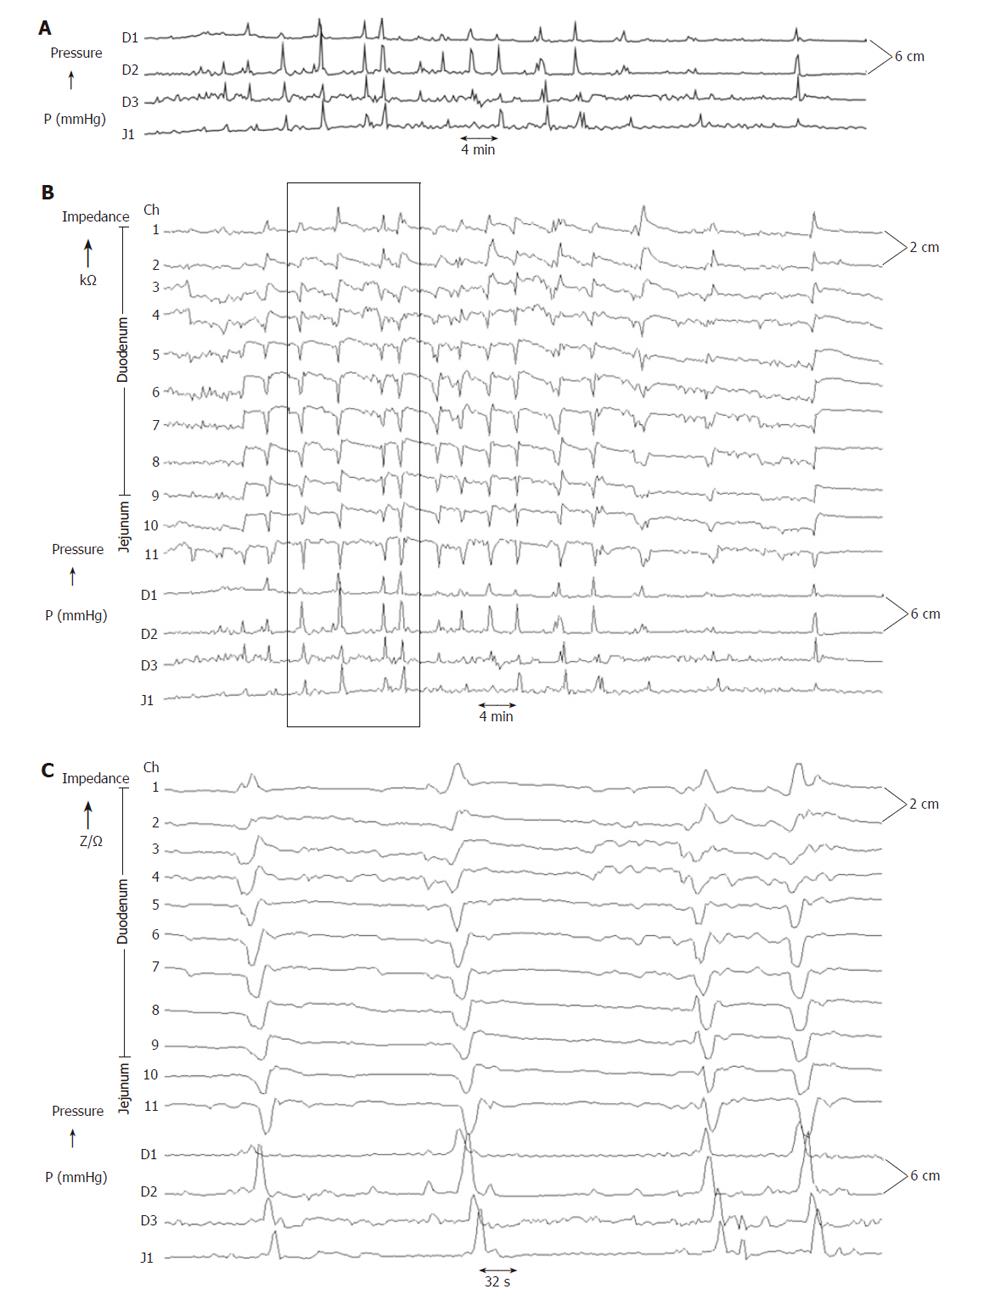
Figure 4 Concurrent Impedance Manometry (CIM) tracings after a test meal.
Upper panel: Low time scaled manometry tracings of the postprandial state. Middle panel: Low time scaled impedance manometry tracings of the same period as above showing several bolus transport events with associated peristaltic activities. Lower panel: High time scaled impedance manometry tracings of the box allowing identification and classification of bolus transport patterns as well as analysis of associated peristaltic patterns.
- Citation: Nguyen HN, Winograd R, Domingues GRS, Lammert F. Postprandial transduodenal bolus transport is regulated by complex peristaltic sequence. World J Gastroenterol 2006; 12(37): 6008-6016
- URL: https://www.wjgnet.com/1007-9327/full/v12/i37/6008.htm
- DOI: https://dx.doi.org/10.3748/wjg.v12.i37.6008


