Copyright
©2006 Baishideng Publishing Group Co.
World J Gastroenterol. Sep 28, 2006; 12(36): 5859-5865
Published online Sep 28, 2006. doi: 10.3748/wjg.v12.i36.5859
Published online Sep 28, 2006. doi: 10.3748/wjg.v12.i36.5859
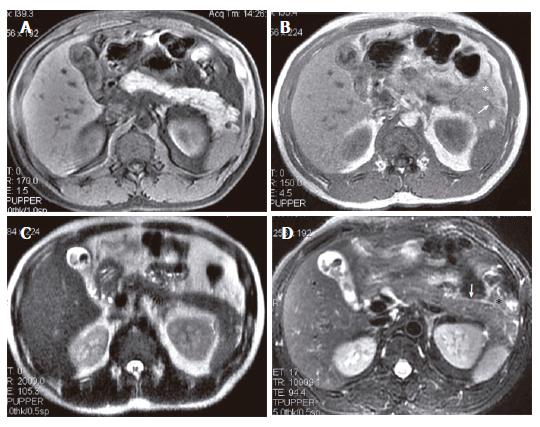
Figure 3 A 45-year-old woman with IEP and cholelithiasis.
(A) SPGR fat-suppressed T1-weighted (TR/TE = 170/1.6 ms) image shows normal pancreatic signal intensity. GRE in-phase (TR/TE = 150/4.4 ms) (B) and SSFSE T2 weighted (TE = 90 ms); (C) images show the pancreatic fascia plane (arrows) and the peripancreatic fat stranding (asterisk), which appear more extensive on R-T T2-weighted (TR/TE = 12 300/98 ms) image (D).
- Citation: Zhang XM, Feng ZS, Zhao QH, Xiao CM, Mitchell DG, Shu J, Zeng NL, Xu XX, Lei JY, Tian XB. Acute interstitial edematous pancreatitis: Findings on non-enhanced MR imaging. World J Gastroenterol 2006; 12(36): 5859-5865
- URL: https://www.wjgnet.com/1007-9327/full/v12/i36/5859.htm
- DOI: https://dx.doi.org/10.3748/wjg.v12.i36.5859


