Copyright
©2006 Baishideng Publishing Group Co.
World J Gastroenterol. Sep 28, 2006; 12(36): 5846-5852
Published online Sep 28, 2006. doi: 10.3748/wjg.v12.i36.5846
Published online Sep 28, 2006. doi: 10.3748/wjg.v12.i36.5846
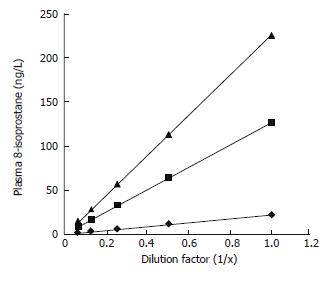
Figure 3 Dilution curves of plasma 8-isoprostane in 3 different plasma samples ( ▲ y = 227.
6x-2.34, r = 0.999; ■ y = 126.3x + 0.06, r = 1.000; ◆ y = 21.8x-0.04, r = 0.999).
- Citation: Kitano S, Hisatomi H, Hibi N, Kawano K, Harada S. Improved method of plasma 8-Isoprostane measurement and association analyses with habitual drinking and smoking. World J Gastroenterol 2006; 12(36): 5846-5852
- URL: https://www.wjgnet.com/1007-9327/full/v12/i36/5846.htm
- DOI: https://dx.doi.org/10.3748/wjg.v12.i36.5846


