Copyright
©2006 Baishideng Publishing Group Co.
World J Gastroenterol. Sep 14, 2006; 12(34): 5483-5489
Published online Sep 14, 2006. doi: 10.3748/wjg.v12.i34.5483
Published online Sep 14, 2006. doi: 10.3748/wjg.v12.i34.5483
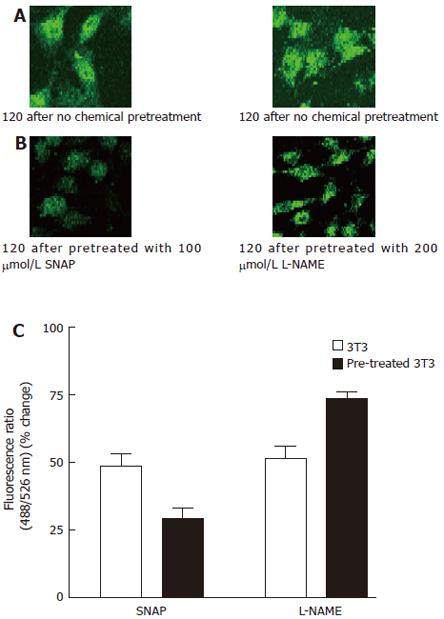
Figure 4 Effect of SNAP and L-NAME on thapsigargin-induced Ca2+ influx.
A: 3T3 cells were incubated in NPBS with 4 μmol/L thapsigargin for 2 min, then 2 mmol/L CaCl2 was added into the medium; B: 3T3 cells were incubated in NPBS with 4 μmol/L thapsigargin for 2 min, 100 μmol/L SNAP or 200 μmol/L L-NAME was introduced 1 min prior to the measurement, then 2 mmol/L CaCl2 was added into the medium; C:.Ca2+ entry fluorescence ratios were obtained in cells without chemical treatment (control) or treated with 100 μmol/L SNAP or 200 μmol/L L-NAME. The values are the mean ± SE (n = 4-6).
- Citation: Huang Y, Lu MQ, Li H, Xu C, Yi SH, Chen GH. Occurrence of cGMP/nitric oxide-sensitive store-operated calcium entry in fibroblasts and its effect on matrix metalloproteinase secretion. World J Gastroenterol 2006; 12(34): 5483-5489
- URL: https://www.wjgnet.com/1007-9327/full/v12/i34/5483.htm
- DOI: https://dx.doi.org/10.3748/wjg.v12.i34.5483


