Copyright
©2006 Baishideng Publishing Group Co.
World J Gastroenterol. Sep 7, 2006; 12(33): 5320-5325
Published online Sep 7, 2006. doi: 10.3748/wjg.v12.i33.5320
Published online Sep 7, 2006. doi: 10.3748/wjg.v12.i33.5320
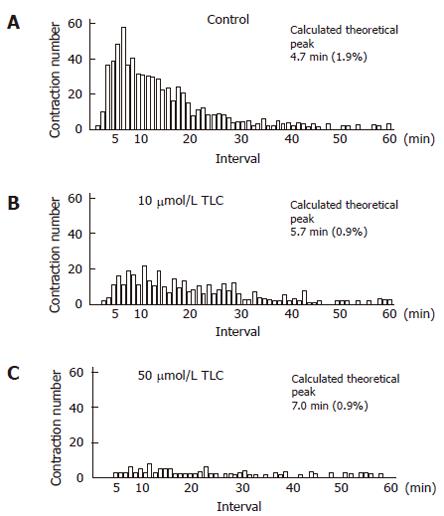
Figure 5 Effects of taurolithocholate (TLC) on the contraction interval of bile canaliculi.
The histogram of the canalicular contraction interval revealed Poisson distribution. In the TLC-treated groups, there was a tendency for the peak height to decrease and shift to the right. The calculated theoretical peak values for each dose were 4.7 min in the control groups (A), 5.7 min at 10 μmol/L TLC (B) and 7.0 min at 50 μmol/L (C). Normalized errors are indicated in parentheses.
- Citation: Watanabe N, Kagawa T, Kojima SI, Takashimizu S, Nagata N, Nishizaki Y, Mine T. Taurolithocholate impairs bile canalicular motility and canalicular bile secretion in isolated rat hepatocyte couplets. World J Gastroenterol 2006; 12(33): 5320-5325
- URL: https://www.wjgnet.com/1007-9327/full/v12/i33/5320.htm
- DOI: https://dx.doi.org/10.3748/wjg.v12.i33.5320


