Copyright
©2006 Baishideng Publishing Group Co.
World J Gastroenterol. Sep 7, 2006; 12(33): 5320-5325
Published online Sep 7, 2006. doi: 10.3748/wjg.v12.i33.5320
Published online Sep 7, 2006. doi: 10.3748/wjg.v12.i33.5320
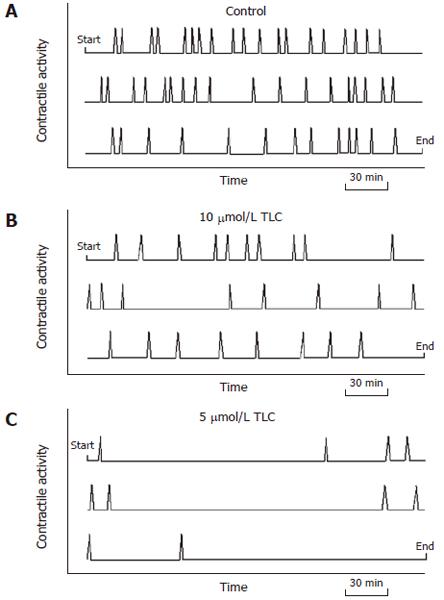
Figure 3 Graphic display of the representative contraction activity of bile canaliculi.
Diagrams represent the 12 h period of observation, beginning at the upper left corner and ending at the lower right corner. The canalicular contractions (spikes) occurred at regular intervals in the control groups (A). The contraction activity visibly diminished as the TLC dosage increased (B, C).
- Citation: Watanabe N, Kagawa T, Kojima SI, Takashimizu S, Nagata N, Nishizaki Y, Mine T. Taurolithocholate impairs bile canalicular motility and canalicular bile secretion in isolated rat hepatocyte couplets. World J Gastroenterol 2006; 12(33): 5320-5325
- URL: https://www.wjgnet.com/1007-9327/full/v12/i33/5320.htm
- DOI: https://dx.doi.org/10.3748/wjg.v12.i33.5320


