Copyright
©2006 Baishideng Publishing Group Co.
World J Gastroenterol. Aug 14, 2006; 12(30): 4773-4783
Published online Aug 14, 2006. doi: 10.3748/wjg.v12.i30.4773
Published online Aug 14, 2006. doi: 10.3748/wjg.v12.i30.4773
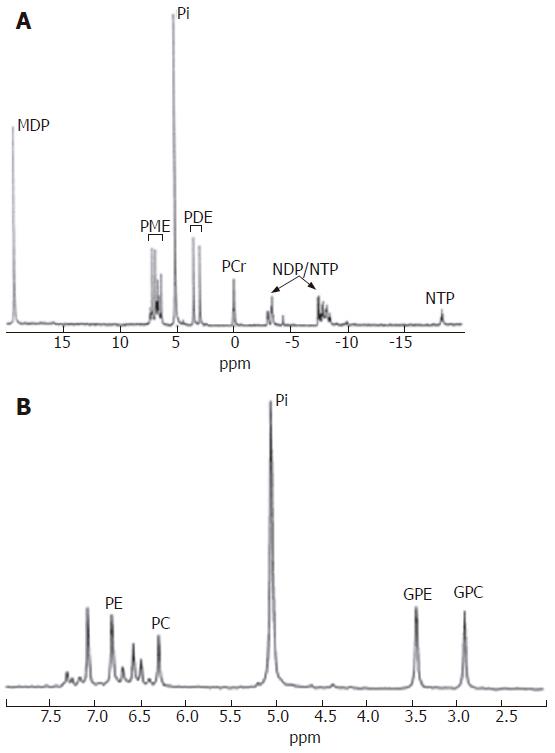
Figure 3 Typical proton decoupled in vitro31P MR spectrum of perchloric acid extracted normal liver tissue.
A: Full spectrum; B: PME and PDE regions. PME: phosphomonoesters; PDE: phosphodiesters; NTP: nucleotide triphosphates; NDP: nucleotide diphosphate; PE: phosphoethanolamine; PC: phosphocholine; GPE: glycerophosphorylethanolamine; GPC: glycerophosphorylcholine; PCr:phosphocreatine; MDP: methylene diphosphonate. Reproduced from Taylor-Robinson et al Gut 1998; 42: 735-743, with permission from the BMJ Publishing Group.
- Citation: Cox IJ, Sharif A, Cobbold JF, Thomas HC, Taylor-Robinson SD. Current and future applications of in vitro magnetic resonance spectroscopy in hepatobiliary disease. World J Gastroenterol 2006; 12(30): 4773-4783
- URL: https://www.wjgnet.com/1007-9327/full/v12/i30/4773.htm
- DOI: https://dx.doi.org/10.3748/wjg.v12.i30.4773


