Copyright
©2006 Baishideng Publishing Group Co.
World J Gastroenterol. Aug 14, 2006; 12(30): 4773-4783
Published online Aug 14, 2006. doi: 10.3748/wjg.v12.i30.4773
Published online Aug 14, 2006. doi: 10.3748/wjg.v12.i30.4773
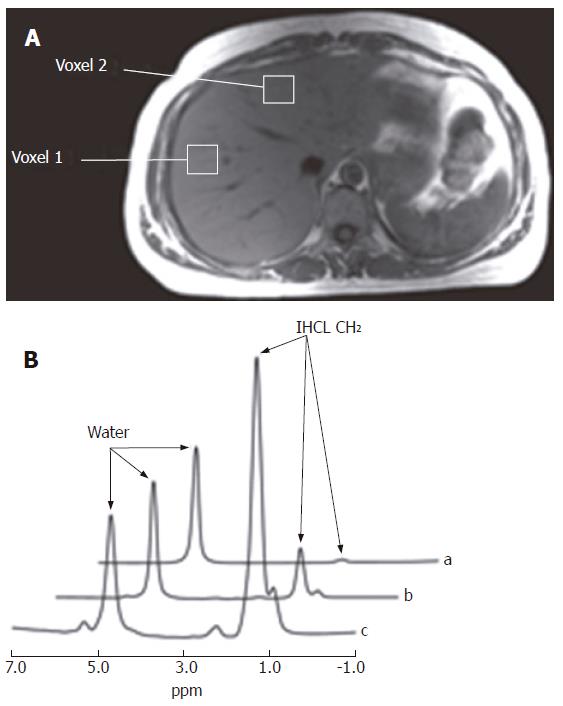
Figure 2 A: A transverse image through the abdomen showing the two voxel positions used to study regional variation in hepatic fat content; B: Typical proton magnetic resonance liver spectra from three volunteers showing progressive degrees of fatty infiltration.
Spectrum (a) shows a liver with minimal fatty infiltration (1.0%), spectrum (b) shows a liver with moderate fatty infiltration (10.2%), and spectrum (c) shows a liver with severe fatty infiltration (74.9%). Resonances from water and IHCL-(CH2)n- can be clearly identified. Values refer to the peak area of the IHCL peak with reference to the water peak after correcting for T1 and T2. IHCL: intrahepatocellular lipids. Reproduced from Thomas et al Gut 2005; 54: 122-127, with permission from the BMJ Publishing Group.
- Citation: Cox IJ, Sharif A, Cobbold JF, Thomas HC, Taylor-Robinson SD. Current and future applications of in vitro magnetic resonance spectroscopy in hepatobiliary disease. World J Gastroenterol 2006; 12(30): 4773-4783
- URL: https://www.wjgnet.com/1007-9327/full/v12/i30/4773.htm
- DOI: https://dx.doi.org/10.3748/wjg.v12.i30.4773


