Copyright
©2006 Baishideng Publishing Group Co.
World J Gastroenterol. Jan 21, 2006; 12(3): 426-430
Published online Jan 21, 2006. doi: 10.3748/wjg.v12.i3.426
Published online Jan 21, 2006. doi: 10.3748/wjg.v12.i3.426
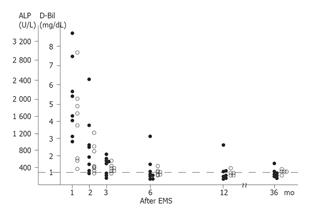
Figure 1 Plotting of the serum alkaline phosphatase concentration (●) and conjugated bilirubin (○) of each patient during 3 yr after EMS.
The broken line indicates the upper limit of normal.
- Citation: Yamaguchi T, Ishihara T, Seza K, Nakagawa A, Sudo K, Tawada K, Kouzu T, Saisho H. Long-term outcome of endoscopic metallic stenting for benign biliary stenosis associated with chronic pancreatitis. World J Gastroenterol 2006; 12(3): 426-430
- URL: https://www.wjgnet.com/1007-9327/full/v12/i3/426.htm
- DOI: https://dx.doi.org/10.3748/wjg.v12.i3.426


