Copyright
©2006 Baishideng Publishing Group Co.
World J Gastroenterol. Jul 28, 2006; 12(28): 4517-4523
Published online Jul 28, 2006. doi: 10.3748/wjg.v12.i28.4517
Published online Jul 28, 2006. doi: 10.3748/wjg.v12.i28.4517
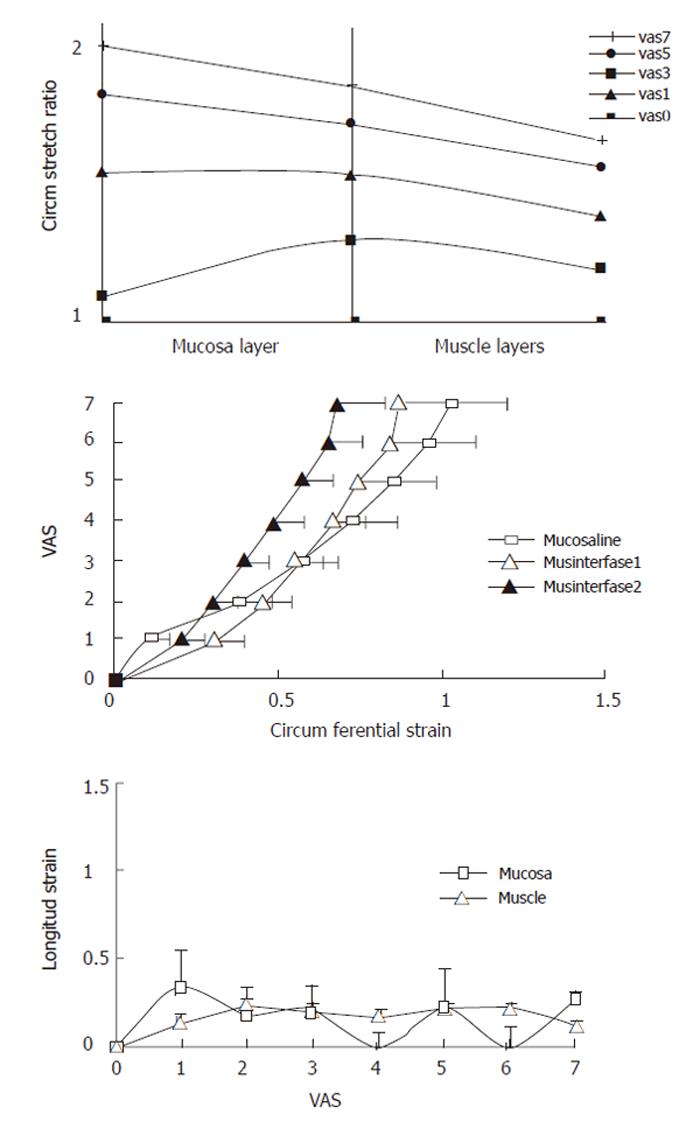
Figure 5 The top graph shows the circumferential stretch ratio at the mucosal surface (left), the interface between the submucosa and circumferential muscle layer (middle) and the serosal surface (right).
The middle graph shows the same data in terms of the circumferential strain and sensory intensity on the visual analogue scale (VAS). There was a strain gradient throughout the esophageal wall with the largest deformation in the mucosa. The bottom graph shows the longitudinal strain as function of the sensory level. No increase in strain was seen during sensory intensity was increased. For convenience the data from all VAS are not shown.
- Citation: Larsen E, Reddy H, Drewes AM, Arendt-Nielsen L, Gregersen H. Ultrasonographic study of mechanosensory properties in human esophagus during mechanical distension. World J Gastroenterol 2006; 12(28): 4517-4523
- URL: https://www.wjgnet.com/1007-9327/full/v12/i28/4517.htm
- DOI: https://dx.doi.org/10.3748/wjg.v12.i28.4517


