Copyright
©2006 Baishideng Publishing Group Co.
World J Gastroenterol. Jul 21, 2006; 12(27): 4383-4388
Published online Jul 21, 2006. doi: 10.3748/wjg.v12.i27.4383
Published online Jul 21, 2006. doi: 10.3748/wjg.v12.i27.4383
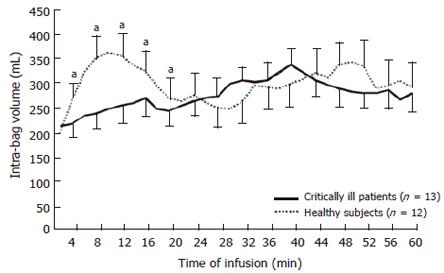
Figure 1 Changes in proximal gastric volume during the 2 kcal/min infusion, in healthy (dotted line, n = 12) and critically ill (solid line, n = 13) subjects.
Data are mean ± SE. aP < 0.05 vs healthy subjects.
- Citation: Nguyen NQ, Fraser RJ, Chapman M, Bryant LK, Holloway RH, Vozzo R, Feinle-Bisset C. Proximal gastric response to small intestinal nutrients is abnormal in mechanically ventilated critically ill patients. World J Gastroenterol 2006; 12(27): 4383-4388
- URL: https://www.wjgnet.com/1007-9327/full/v12/i27/4383.htm
- DOI: https://dx.doi.org/10.3748/wjg.v12.i27.4383


