Copyright
©2006 Baishideng Publishing Group Co.
World J Gastroenterol. Jul 21, 2006; 12(27): 4310-4317
Published online Jul 21, 2006. doi: 10.3748/wjg.v12.i27.4310
Published online Jul 21, 2006. doi: 10.3748/wjg.v12.i27.4310
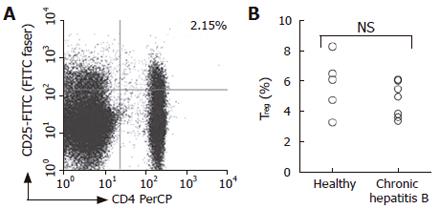
Figure 4 Comparison of CD4+CD25high T cell population between patients with hepatitis B and healthy subjects.
The cells that express CD4, CD25high and CTLA-4 were identified by flow cytometry. Representative dot plots of an ex vivo sample of a patient with CHB is shown (A), numbers shown in the dot plot indicates percentage of cells in the quadrant lesion. Percentage of CD4+CD25+ T cells was shown for patients with CHB and healthy subjects (B).
- Citation: Kondo Y, Kobayashi K, Ueno Y, Shiina M, Niitsuma H, Kanno N, Kobayashi T, Shimosegawa T. Mechanism of T cell hyporesponsiveness to HBcAg is associated with regulatory T cells in chronic hepatitis B. World J Gastroenterol 2006; 12(27): 4310-4317
- URL: https://www.wjgnet.com/1007-9327/full/v12/i27/4310.htm
- DOI: https://dx.doi.org/10.3748/wjg.v12.i27.4310


