Copyright
©2006 Baishideng Publishing Group Co.
World J Gastroenterol. Jul 21, 2006; 12(27): 4310-4317
Published online Jul 21, 2006. doi: 10.3748/wjg.v12.i27.4310
Published online Jul 21, 2006. doi: 10.3748/wjg.v12.i27.4310
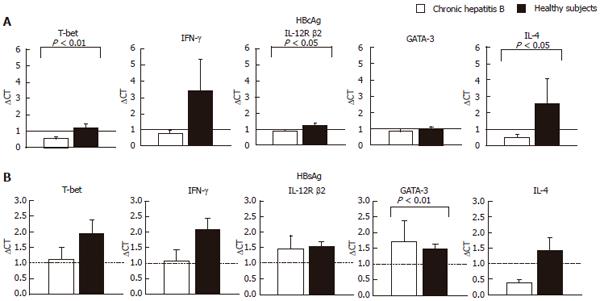
Figure 1 Comparison of levels of mRNAs for T-bet and GATA-3 after stimulation with HBsAg and HBcAg with mRNAs for IFN-gamma, IL-10 and IL-4.
Total cellular RNA was extracted from CD4+ T cells after the stimulation of PBMCs with HBcAg (10 μg/mL) or HBsAg (29 μg/mL) for 24 h. A: HBcAg stimulation; B: HBsAg stimulation. Levels of mRNA for T-bet, GATA-3, IFN-γ, IL-12R β2 and IL-4 were quantified by TaqMan PCR. GAPDH was used as an internal control. Relative amount of target mRNA was calculated using comparative CT method. The expression level of mRNAs of the non-stimulated sample in each subject is represented as 1.0 and relative amount of target mRNA in a stimulated sample was calculated using the as following formula: relative amount = 2-ΔΔCT, where ΔΔCT was given by subtracting ΔCT (non-stimulated cells) from ΔCT (stimulated cells). The ΔCT value was determined by subtracting the GAPDH CT value from the target CT value. The validation experiments were performed in advance for all the target mRNAs to demonstrate that efficiency of each target and GAPDH are approximately equal.
- Citation: Kondo Y, Kobayashi K, Ueno Y, Shiina M, Niitsuma H, Kanno N, Kobayashi T, Shimosegawa T. Mechanism of T cell hyporesponsiveness to HBcAg is associated with regulatory T cells in chronic hepatitis B. World J Gastroenterol 2006; 12(27): 4310-4317
- URL: https://www.wjgnet.com/1007-9327/full/v12/i27/4310.htm
- DOI: https://dx.doi.org/10.3748/wjg.v12.i27.4310


