Copyright
©2006 Baishideng Publishing Group Co.
World J Gastroenterol. Jul 7, 2006; 12(25): 4056-4060
Published online Jul 7, 2006. doi: 10.3748/wjg.v12.i25.4056
Published online Jul 7, 2006. doi: 10.3748/wjg.v12.i25.4056
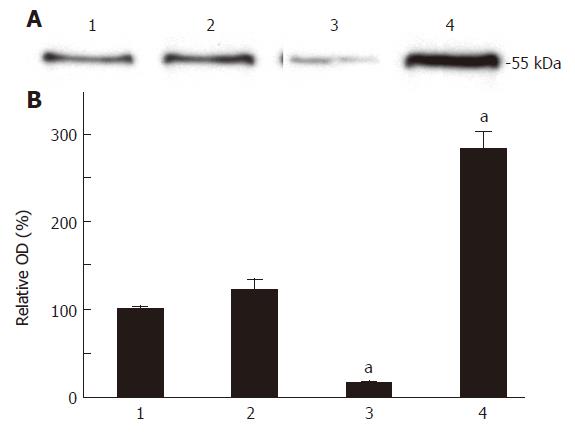
Figure 2 A: Western blot analysis of the T-STAR protein expression level of each group of cells; B: Densitometry analysis of the amount of T-STAR protein expression in each group of cells, aP < 0.
01 vs 2. 1: HCT; 2: HCT-pcDNA; 3: HCT-asSTAR; 4: HCT-STAR.
- Citation: Zhang L, Guo L, Peng Y, Chen B. Expression of T-STAR gene is associated with regulation of telomerase activity in human colon cancer cell line HCT-116. World J Gastroenterol 2006; 12(25): 4056-4060
- URL: https://www.wjgnet.com/1007-9327/full/v12/i25/4056.htm
- DOI: https://dx.doi.org/10.3748/wjg.v12.i25.4056


