Copyright
©2006 Baishideng Publishing Group Co.
World J Gastroenterol. Jul 7, 2006; 12(25): 4020-4025
Published online Jul 7, 2006. doi: 10.3748/wjg.v12.i25.4020
Published online Jul 7, 2006. doi: 10.3748/wjg.v12.i25.4020
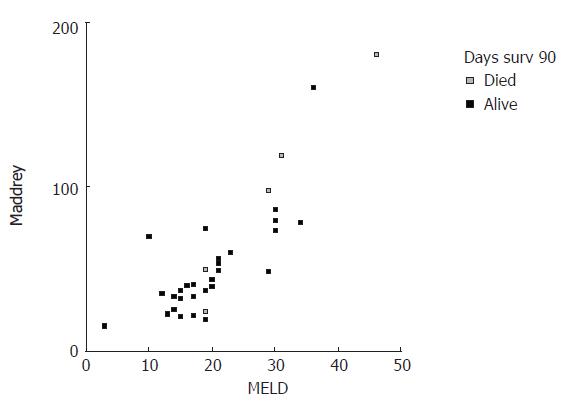
Figure 1 Scatter plot graphed for patient death events within 90 d in correlation with corresponding MELD and DF values.
- Citation: Soultati AS, Dourakis SP, Alexopoulou A, Deutsch M, Vasilieva L, Archimandritis AJ. Predicting utility of a model for end stage liver disease in alcoholic liver disease. World J Gastroenterol 2006; 12(25): 4020-4025
- URL: https://www.wjgnet.com/1007-9327/full/v12/i25/4020.htm
- DOI: https://dx.doi.org/10.3748/wjg.v12.i25.4020


