Copyright
©2006 Baishideng Publishing Group Co.
World J Gastroenterol. Jun 7, 2006; 12(21): 3453-3455
Published online Jun 7, 2006. doi: 10.3748/wjg.v12.i21.3453
Published online Jun 7, 2006. doi: 10.3748/wjg.v12.i21.3453
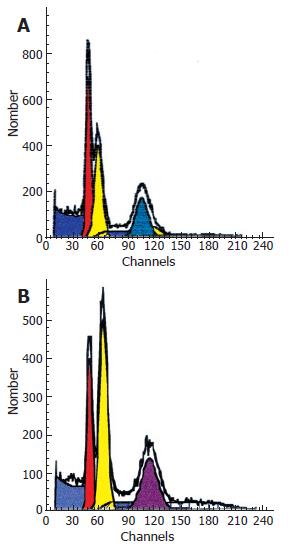
Figure 2 DNA histograms.
A: Smaller tumor with two aneuploid peaks: left peak-hypodiploid population with DNA index of 1.22; right peak-hyperdiploid population with DNA index of 2.22. Middle peak-the diploid population of non tumoral cells; B: Larger tumor with two aneuploid peaks: left peak-hypodiploid population with DNA index of 1.32; right peak-hyperdiploid population with DNA index of 2.33. Middle peak-the diploid population of non tumoral cells.
- Citation: Balicevic D, Tomic K, Bekavac-Beslin M, Kovacevic I, Mijic A, Belicza M, Kruslin B. Synchronous anorectal melanoma. World J Gastroenterol 2006; 12(21): 3453-3455
- URL: https://www.wjgnet.com/1007-9327/full/v12/i21/3453.htm
- DOI: https://dx.doi.org/10.3748/wjg.v12.i21.3453


