Copyright
©2006 Baishideng Publishing Group Co.
World J Gastroenterol. Jun 7, 2006; 12(21): 3450-3452
Published online Jun 7, 2006. doi: 10.3748/wjg.v12.i21.3450
Published online Jun 7, 2006. doi: 10.3748/wjg.v12.i21.3450
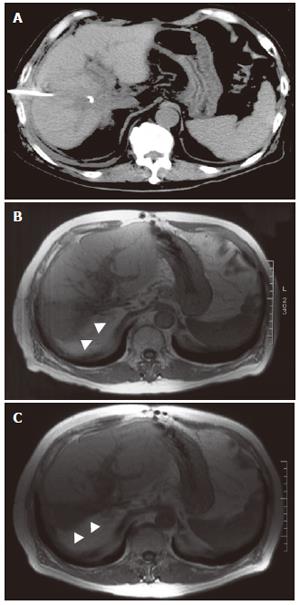
Figure 3 Follow-up computed tomography taken before ethanol injection (A), magnetic resonance imaging 3 mo (B) and 15 mo (C) after injection.
Arrows indicate the atrophy of the ethanol-injected anterior segment.
- Citation: Shimizu T, Yoshida H, Mamada Y, Taniai N, Matsumoto S, Mizuguchi Y, Yokomuro S, Arima Y, Akimaru K, Tajiri T. Postoperative bile leakage managed successfully by intrahepatic biliary ablation with ethanol. World J Gastroenterol 2006; 12(21): 3450-3452
- URL: https://www.wjgnet.com/1007-9327/full/v12/i21/3450.htm
- DOI: https://dx.doi.org/10.3748/wjg.v12.i21.3450


